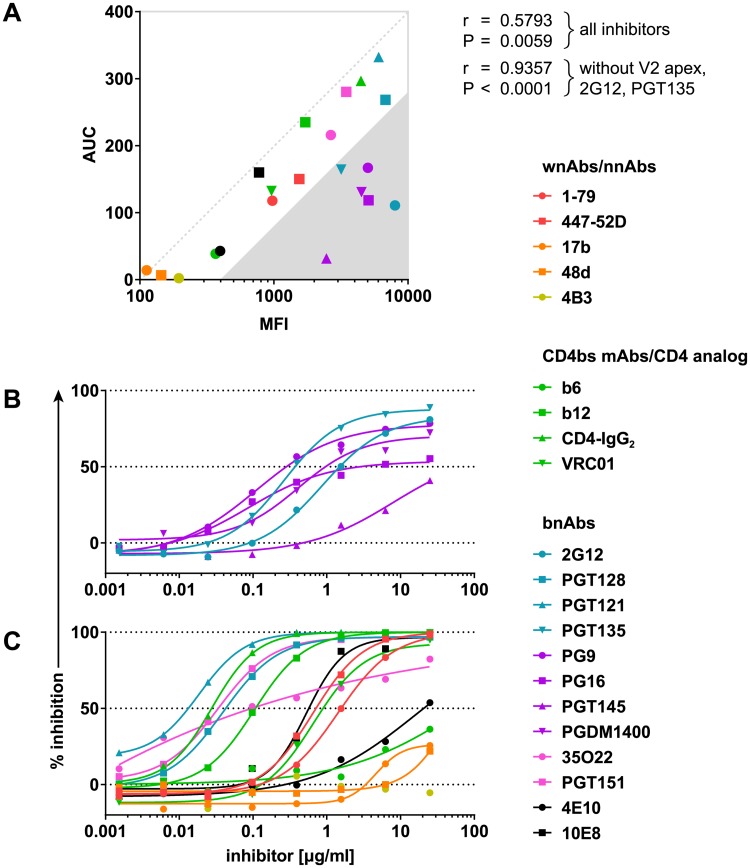
Fig 5. Relationship between BaL.01 neutralization and Env binding capacity.
(A) Correlation between the inhibitor binding to the native, CD4-unbound BaL.01 Env (MFI data from Fig 4) and neutralization of the BaL.01 pseudovirus expressed as the AUC derived from neutralization data shown in panels B and C. Pearson’s r coefficients and respective P values were calculated taking into consideration either all probed inhibitors or all inhibitors excluding V2 apex bnAbs (PG9, PG16, PGT145, PGDM1400), 2G12, and PGT135. (B, C) Inhibition curves of BaL.01 pseudovirus neutralization assay for (B) V2 apex bnAbs, 2G12, and PGT135 and (C) other mAbs and inhibitors. Binding/neutralization relationships for MN.3, JR-FL, and BG505_T332N Envs as well as the corresponding inhibition curves are depicted in S10 Fig. Data represent a single experiment. AUC, area under the inhibition curve; BG505_T332N, BG505.W6M.ENV.C2_T332N; bnAb, broadly neutralizing antibody; CD4bs, CD4 binding site; Env, envelope glycoprotein; mAb, monoclonal antibody; nnAb, nonneutralizing antibody; MFI, mean of fluorescence intensity; V2, second hypervariable; wnAb, weakly neutralizing antibody.

