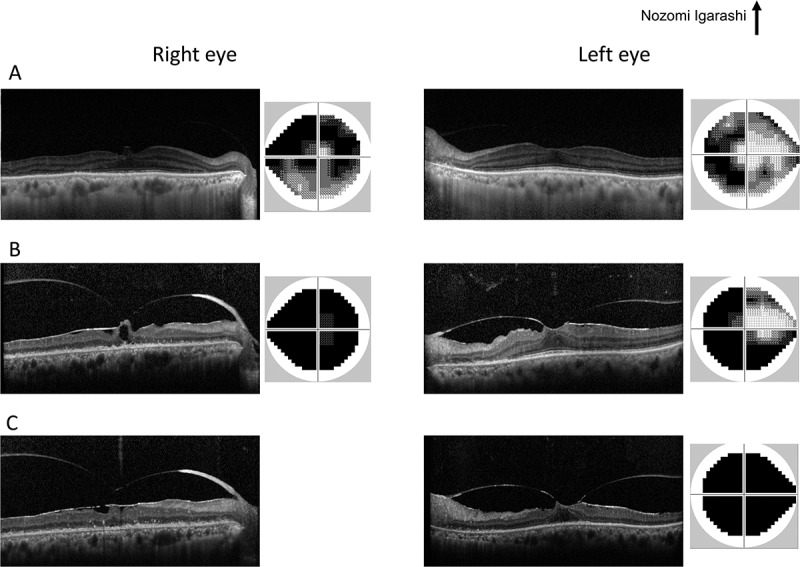
Figure 3.

The time course of SD-OCT images and Humphrey visual fields at initial presentation (A), during oral prednisolone treatment (B), and after plasmapheresis treatment (C). The results from the right and left eyes are displayed in the left and right halves, respectively.
