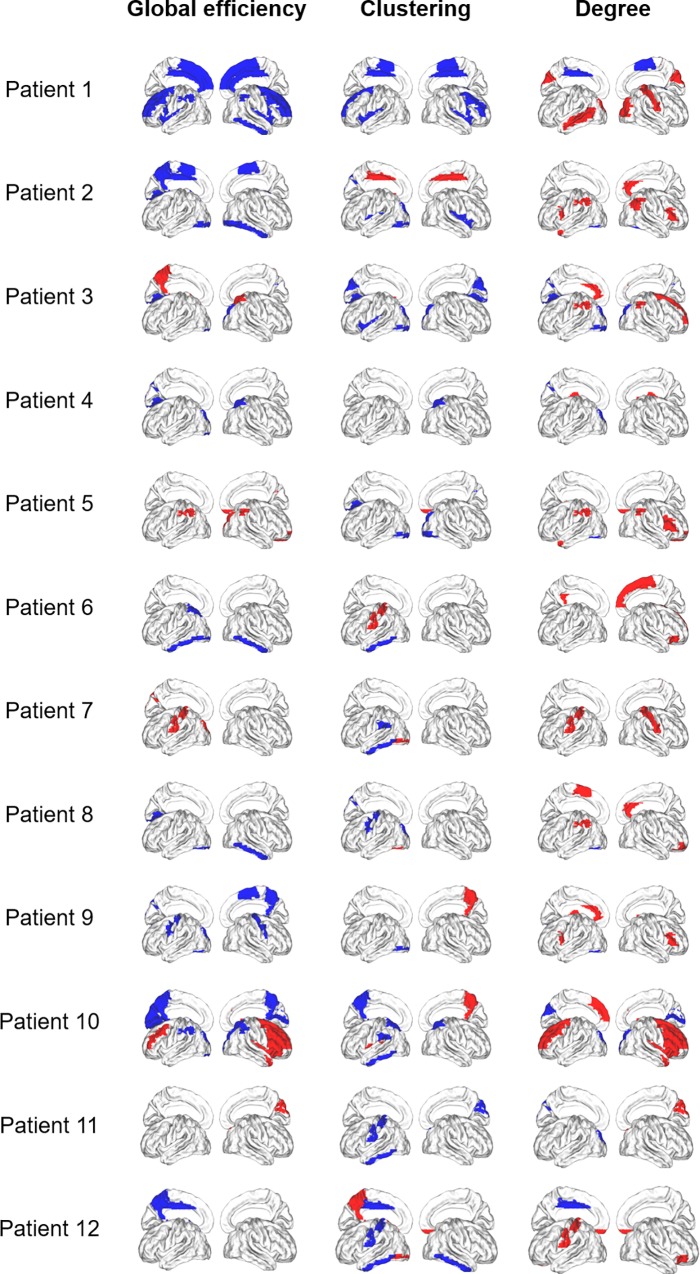
Fig 2. Disconnected and overconnected nodes in NMOSD patients.
Cortical surface representation of the difference in mean global efficiency, clustering, and degree between patient and volunteer groups (in red significantly increased parameter in NMOSD patients compared with healthy subjects, and in blue significantly decreased parameter in NMOSD patients).

