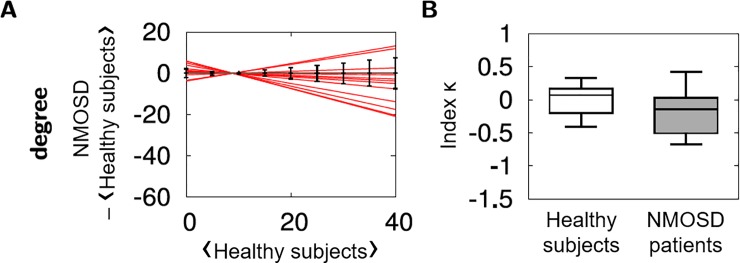
Fig 3. Comparison of nodal degree and hub disruption index κ between NMOSD patients and healthy subjects.
(A) Estimated linear regression for each NMOSD patients (red lines) computed from a scatterplot of the nodal degree in an individual participant minus the same nodal property on average over all of the healthy volunteers versus the mean nodal property in the healthy group. Error bars in black reflect standard deviation calculated from the nodal degree in healthy subjects. (B) Boxplots of hub disruption index κ in the control group (white) and the NMOSD group (grey). There was no difference between the two groups.

