Fig. 1.
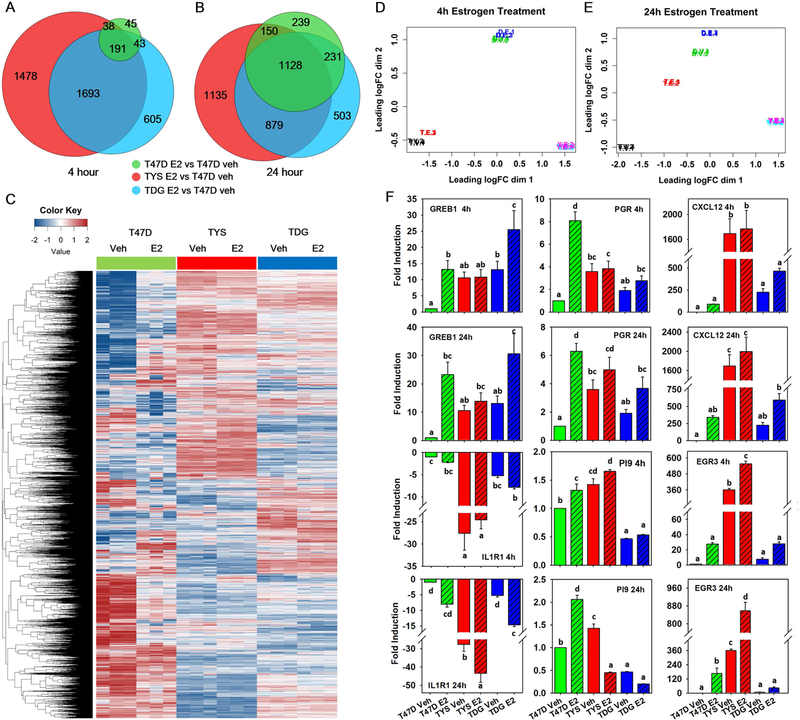
TYS and TDG cells exhibit unique gene expression patterns. A,B Venn diagrams comparing genes with absolute fold change >2 and false discovery rate (FDR) q-value <0.05 in T47D, TYS and TDG cells after 4h A and 24h B E2 treatment. C Heatmap showing log counts per million (CPM) of genes that have CPM >1 in at least 3 samples after 24h E2 treatment. D,E Multi-dimensional scaling (MDS) plot of RNAseq samples 4h D and 24h E after E2 addition. Similarities of gene expression patterns were calculated and mapped for T47D (T), TYS (Y) and TDG (D) cells treated with vehicle (V) or estrogen (E). Data from each of the three biological replicates is shown. F Real-time PCR analysis of GREB1, PGR, CXCL12, IL1R1, PI9 and EGR3 in T47D, TYS and TDG cells after addition of vehicle or E2 for 4h or 24h. (mean ± s.e.m., n=3). Different letters indicate a significant difference among groups (P<0.05) using one-way ANOVA followed by Duncan’s post hoc test.

