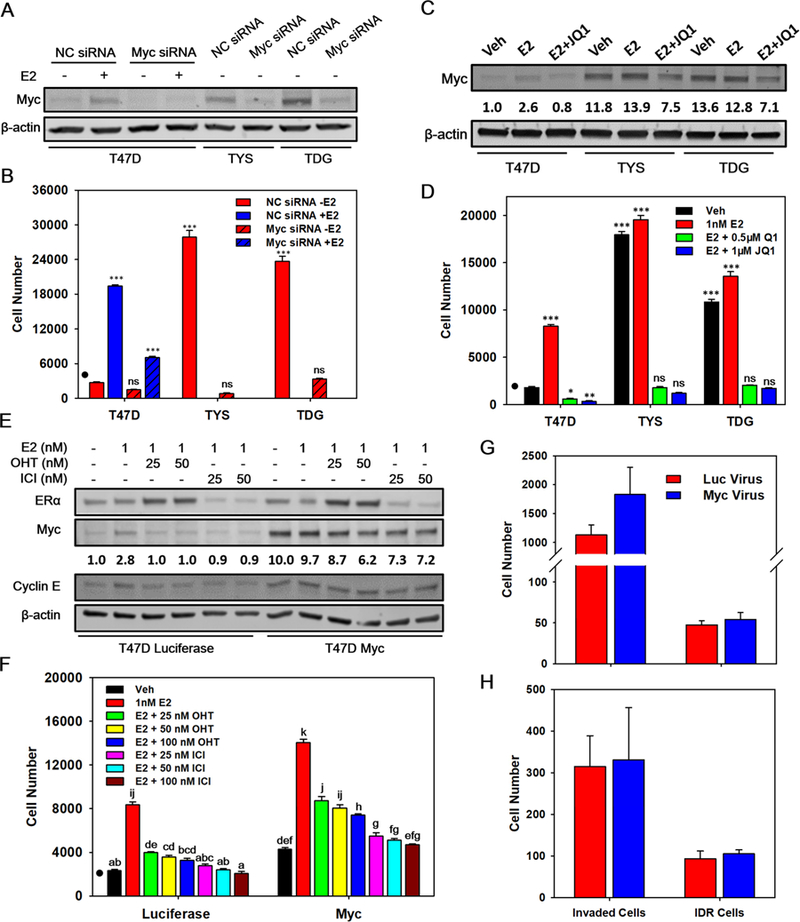
Fig. 5.

Myc is necessary and sufficient for estrogen-independent cell proliferation and antiestrogen resistance, but does not affect invasiveness. A Western blot showing Myc protein levels after treatment of T47D, TYS and TDG cells with 100 nM non-coding (NC) or Myc SMARTpool siRNA for 24h, followed by treatment with vehicle or 1 nM E2 for 24h. B Proliferation of T47D, TYS and TDG cells treated with 100 nM NC or Myc SMARTpool siRNA, followed by treatment with vehicle or 1 nM E2 for 96 h (mean ± s.e.m., n=6). C Western blot showing Myc levels following treatment of cells with vehicle or 1 nM E2 with, or without, 1 µM JQ1 for 8h. D Proliferation of T47D, TYS and TDG cells treated with vehicle, E2, or E2 plus 0.5 or 1 µM JQ1 for 96 h (mean ± s.e.m., n=6). E Western blot showing ERα, Myc and Cyclin E levels in T47D, TYS and TDG cells treated with Myc-lentivirus or control luciferase-lentivirus, followed by the indicated concentrations of E2, OHT and ICI for 24h. F Proliferation of T47D, TYS and TDG cells, after transduction with Myc or control lentivirus containing medium for 24h, followed by treatment with the indicated concentrations of E2, OHT and ICI for 4 days. (mean ± s.e.m., n=6). B,D,F ‘•’ denotes cell number at day 0. C,E Myc protein levels were quantitated using a PhosphorImager and ImageQuant. B,D * indicates a significant difference among groups using one-way ANOVA followed by Tukey’s post hoc test. *P<0.05, **P<0.005, ***P<0.001. ns, not significant. F Different letters indicate a significant difference among groups (P<0.05) using one-way ANOVA followed by Tukey’s post hoc test. G,H IDR assay of T47D cells transduced with Myc-lentivirus or luciferase-lentivirus with collagen- G or matrigel-coated H membrane and chamber (mean ± s.e.m., n=5). Cells were transduced with virus and after 1 day total invaded cells and cells that invaded, then dissociated and rebound (IDR) were measured using their luciferase activity and a standard curve for each cell line of luciferase activity versus cell number.
