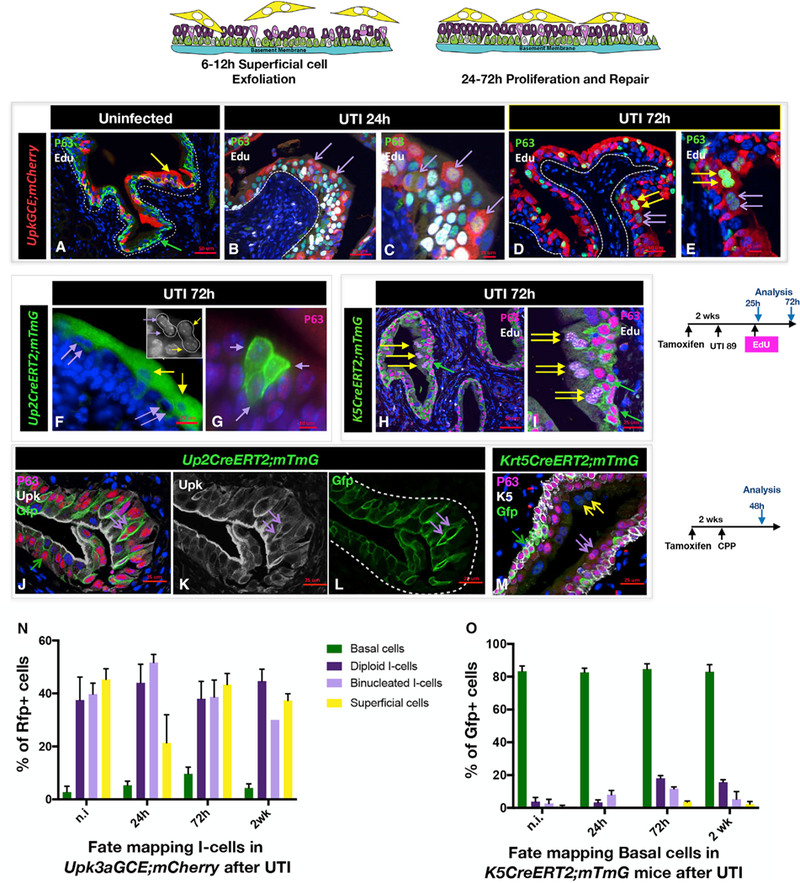
Figure 2. Binucleated I-Cells Are Produced by I-Cells after Acute Injury and Give Rise to Superficial Cells.

(A) A paraffin section from an uninfected adult Upk3aGCE;mCherry mouse stained for expression of EdU and P63. Scale bar, 50 µm.
(B) A paraffin section from a Upk3aGCE;mCherry mouse 24 hr after UTI, stained for expression of mCherry, p63, and EdU. Purple arrows point to the mCherry-positive mononucleated I-cells. Scale bar, 50 µm.
(C) Same sample used in (B) but at a higher magnification.
(D) A paraffin section from a Upk3aGCE;mCherry mouse 72 hr after UTI stained for expression of mCherry, p63, and EdU. The double yellow arrows point to the mCherry-positive S-cells, which have been generated following UTI. The purple double arrows point to the mCherry-positive binucleated I-cells.
(E) Higher magnification of image in (D). Scale bar, 50 µm.
(F) A cryosection from a Upk2CreERT2;mTmG adult mouse 72 hr after UTI showing lineage-marked binucleated I-cells and S-cells. Scale bar, 25 µm.
(G) A cryosection from a Upk2CreERT2;mTmG adult mouse 72 hr p.i. stained with P63 shows a clone of mononucleated I-cells. Scale bar, 10 µm.
(H) A paraffin section from an adult K5CreER;mTmG mouse 72 hr after UTI stained for expression of Gfp, P63, and EdU. The double yellow arrows point to Gfp-negative S-cells. Scale bar, 50 µm.
(I) Same sample used in (B) but at a higher magnification.
(J) A paraffin section isolated from a CPP-treated adult Upk2CreERT2;mTmG mouse 48 hr after CPP treatment, stained with P63, Upk, and Gfp. Scale bar, 25 µm.
(K) Same sample used in (J) but showing Upk expression. The double purple arrows point to a binucleated I-cell expressing Gfp. Scale bar, 25 µm.
(L) Same sample used in (J) but showing Gfp expression.
(M) A section from a K5CreER;mTmG mouse 48 hr after administration of CPP and stained with P63 and K5. Scale bar, 25 µm.
(N) Quantification of lineage-marked urothelial populations at different stages after UTI in Upk3aGCE;Rfp mice. For quantification, a minimum of three inde-pendent experiments were performed, and numbers are means of percentages ± SEM.
(O) Quantification of lineage-marked urothelial populations at different stages after UTI in K5CreER;mTmG mice.
