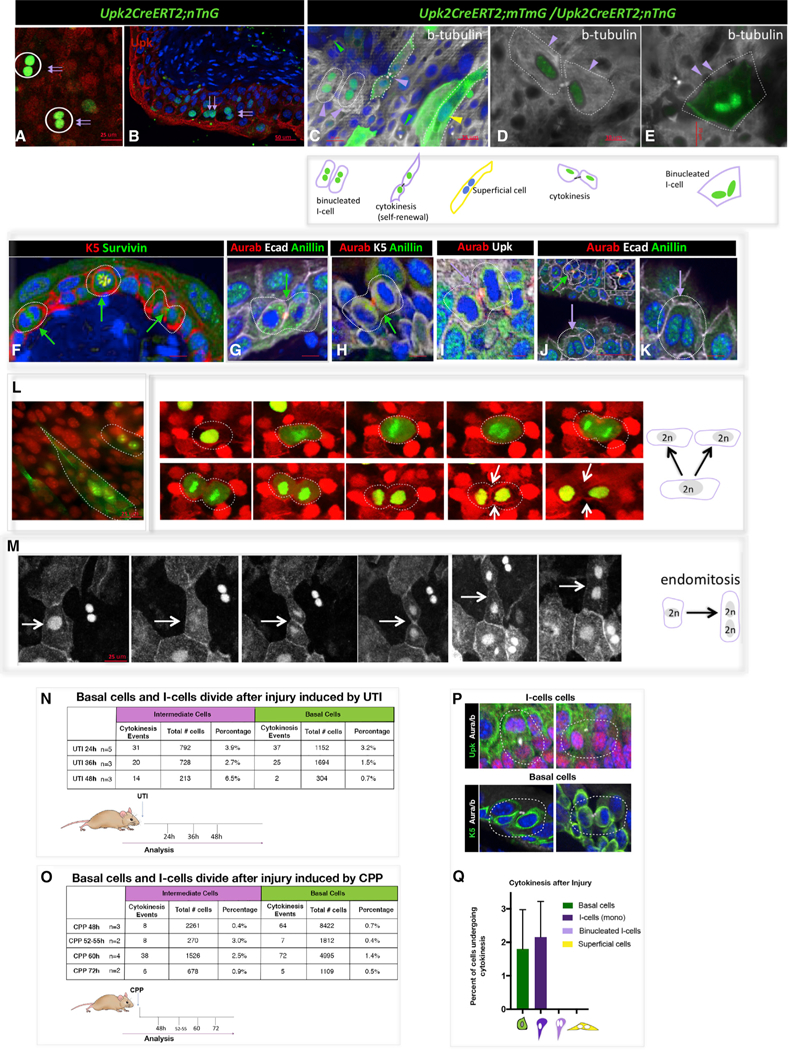
Figure 3. Binucleated I-Cells Form via Endomitosis.

(A) Nuclear Gfp and Tomato expression in a whole-mount preparation from a Up2CreERT2;nTnG mouse. Scale bar, 25 µm.
(B) A section from a Up2CreERT2;nTnG mouse 24 hr after UTI shows binucleated Gfp+ I-cells (purple arrows). Scale bar, 50 µm.
(C) Whole-mount prep of urothelium from an adult Up2CreERT2;mTmG;nTnG mouse isolated 24 hr after UTI and stained with beta-tubulin showing membrane-bound Gfp in an I-cell that has divided and in an S-cell (purple and green arrowheads), as well as an unlabeled basal cell which is dividing.
(D) Whole-mount prep of urothelium from an adult Up2CreERT2;mTmG;nTnG mouse isolated 24 hr after UTI and stained with beta-tubulin showing a pair of I-cells that have undergone cytokinesis.
(E) Whole-mount prep of urothelium from an adult Up2CreERT2;mTmG;nTnG mouse isolated 24 hr after UTI and stained with beta-tubulin showing membrane and nuclear Gfp staining in a binucleated I-cell, which is negative for b-tubulin expression and is therefore likely to be a produce of incomplete cytokinesis. Yellow arrowheads denote S-cells, purple arrowheads deonote I-cells and green arrowheads denote Basal cells.
(F) A paraffin section from a CPP-treated wild-type mouse 48 hr after CPP treatment, stained for K5 and Survivin expression. Scale bar, 25 µm.
(G) A paraffin section from a CPP-treated wild-type mouse 48 hr after CPP treatment, stained for Ecad anillin and Aura/b expression. Scale bar, 25 µm.
(H) A paraffin section from a CPP-treated wild-type mouse 48 hr after CPP treatment, stained for K5, anillin, and Aura/b expression. Scale bar, 25 µm.
(I) A paraffin section from a CPP-treated wild-type mouse 48 hr after CPP treatment, stained for Upk and Aura/b expression. Scale bar, 25 µm.
(J) A paraffin section from a CPP-treated wild-type mouse 48 hr after CPP treatment, stained for Ecad, anillin, and Aura/b expression. Scale 50 µm.
(K) Same sample used in (J) but at a higher magnification. The purple arrow points to a binucleated I-cell that is not expressing mitotic markers. Scale bar, 10 µm.
(L) A whole-mount preparation from a cultured Up2CreERT2;mTmG;nTnG mouse urothelium showing lineage-marked binucleated I-cells and S-cells and a series of images from a real-time video of cultured urothelium and stroma from a Up2CreERT2;mTmG;nTnG mouse showing an I-cell undergoing normal cytokinesis. White arrow points to the cleavage furrow. Scale bar, 25 µm.
(M) A series of images from a real-time move of cultured urothelium and stroma from a Up2CreERT2;mTmG;nTnG mouse undergoing endomitosis. The white arrows point to the cleavage furrow, which forms and then regresses. Scale bar, 25 µm.
(N) Quantitation of cytokinetic events in I-cells and basal cells after UTI.
(O) Quantitation of cytokinetic events in I-cells and basal cells after injury and regeneration induced by CPP.
(P) Images showing examples of I-cells and basal cells stained with Aura/b, showing cells undergoing cytokinesis.
(Q) Comparison of cytokinetic events in basal cells, mononuclear I-cells, binuclear I-cells, and S-cells after injury. For quantification, a minimum of three inde-pendent experiments were performed, and numbers are means of percentages ± SEM.
