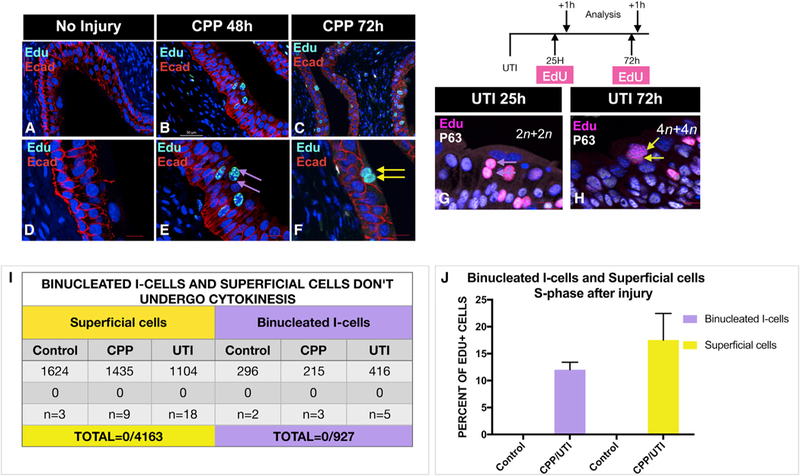
Figure 4. Binucleated I-Cells and S-Cells Are Likely to Increase Ploidy by Endocycling.

(A) A section from the urothelium of an untreated adult mouse stained for expression of Ecad and EdU. Scale bar, 50 µm.
(B) A section from an adult mouse 48 hr after CPP, given a 1-hr pulse of EdU stained for EdU and Ecad. Note EdU-expressing binucleated I-cells, which are likely to be in S phase. Scale bar, 50 µm.
(C) A section from an adult mouse 72 hr after CPP, given a 1-hr pulse of EdU prior to sacrifice stained for expression of Ecad and EdU. Note EdU-expressing S-cells, which are likely to be in S phase. Scale bar, 50 µm.
(D) Same sample used in (A) but at a higher magnification.
(E) Same sample used in (B) but at a higher magnification.
(F) Same sample used in (C) but at a higher magnification.
(G) A paraffin stained section from an adult mouse 24 hr p.i. analyzed 1 hr after a pulse of EdU and stained for EdU and P63 expression. Scale bar, 25 µm.
(H) A paraffin-stained section from an adult mouse 72 hr p.i. analyzed 1 hr after a pulse of EdU and stained for EdU and P63 expression. Scale bar, 25 µm.
(I) A table showing a summary of quantification of binucleated I-cells and S-cells in cytokinesis.
(J) A bar graph showing the percentage of EdU+ binucleated I-cells and S-cells after a 1-hr pulse, which are likely to be in S phase, in animals 24–72 hr after UTI and CPP-induced injury and repair.
