Figure 3.

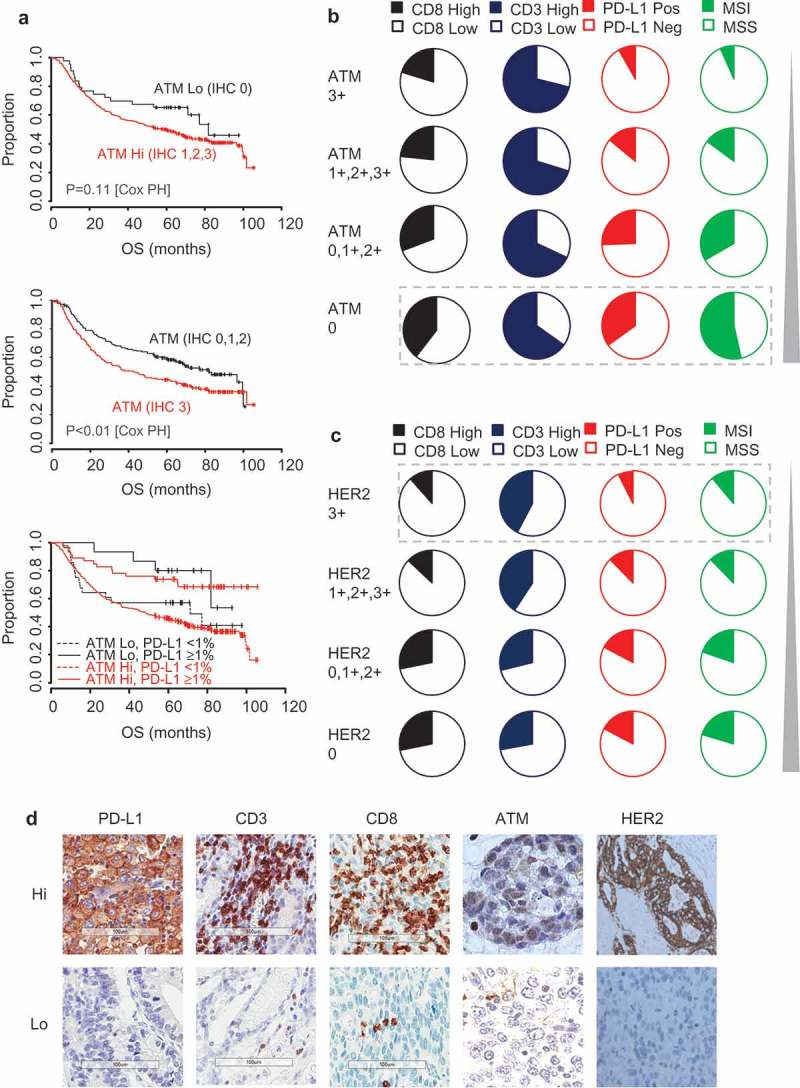
ATM-low and HER2-high segments are mutually exclusive and differ in their immune profile.
(a) Kaplan-Meier estimates of overall survival (OS) according to ATM and PD-L1 TC stratification. Pie charts depict the frequency of patients with High and Low CD8, CD3 and PD-L1 TC densities and MSI status in (b) ATM and (c) HER2 populations. (d) Representative images for high and low examples of PD-L1, CD3, CD8, ATM and HER2. The cut-offs used were PD-L1 TC (≥ 1%), CD3 (500 cells/mm2) and CD8 (600 cells/mm2). Data were statistically analysed by Cox Proportional Hazards (*P < 0.05, **P < 0.01, ***P < 0.001).
