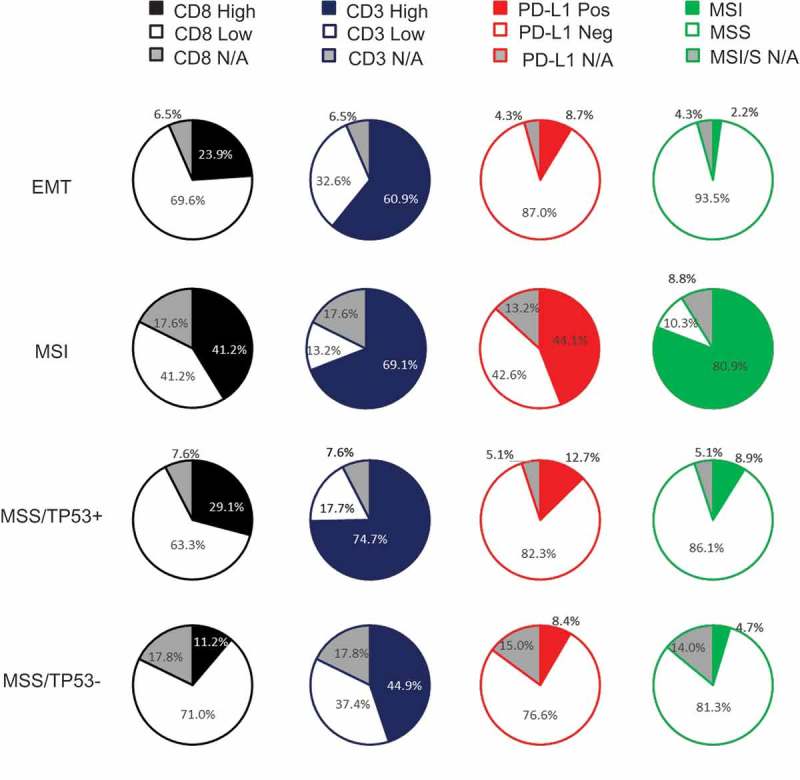
Figure 4.

Distribution of CD8, CD3, PD-L1 according to subtypes.
Pie charts depict the frequency of patients with CD8, CD3, PD-L1 and MSI. The cut-offs used were PD-L1 TC (≥ 1%), CD3 (500 cells/mm2) and CD8 (600 cells/mm2).

Distribution of CD8, CD3, PD-L1 according to subtypes.
Pie charts depict the frequency of patients with CD8, CD3, PD-L1 and MSI. The cut-offs used were PD-L1 TC (≥ 1%), CD3 (500 cells/mm2) and CD8 (600 cells/mm2).