. 2019 Jan 29;8:e41351. doi: 10.7554/eLife.41351

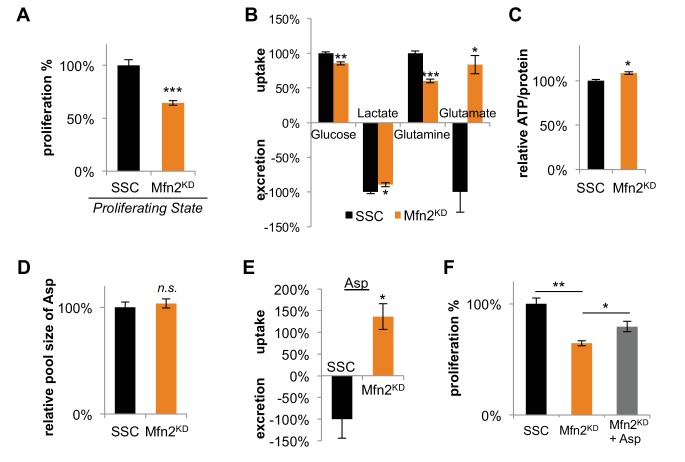
Figure 3. Inhibition of mitochondrial fusion by Mfn2 knockdown slows proliferation by limiting aspartate synthesis.

(A) Proliferation was assessed by using a CyQUANT assay after cells were treated with scrambled siRNA control (SSC) or Mfn2 siRNA for 72 hr (n = 5). (B) Mfn2 knockdown alters nutrient utilization (n = 4). Glutamine consumption decreases in Mfn2 knockdown cells, which is consistent with a decreased demand for glutamine to fuel a reduced level of OXPHOS. (C) Intracellular ATP levels in scrambled siRNA controls (SSC) were lower relative to Mfn2 knockdowns. ATP luminescence signals were normalized to protein amount (n = 5). (D) The intracellular pool of aspartate remained unchanged upon Mfn2 knockdown (n = 3). Pool sizes were normalized by dry cell mass and internal standard. (E) Scrambled siRNA controls excrete aspartate into the media, while Mfn2 knockdowns uptake aspartate from the media (n = 4). (F) Supplementing the media with 1 mM aspartate partially rescued the proliferation of Mfn2 knockdowns (n = 6). Data are presented as mean ±SEM. *p<0.05, **p<0.01, ***p<0.001, n.s. not statistically significant.

Figure 3—source data 1. Sequences for dicer-substrate short interfering RNA (DsiRNA) and siRNA-resistant Mfn2res.
DOI: 10.7554/eLife.41351.019

Figure 3.

Figure 3—figure supplement 1. Expression of siRNA-resistant Mfn2 (Mfn2res) in Mfn2 knockdowns restored Mfn2 protein level, mitochondrial respiration, and cellular proliferation.

Figure 3—figure supplement 1.

(A) Immunoblot analysis of Mfn2 in whole-cell lysates of scrambled siRNA controls expressing GFP (SSC + GFP), Mfn2 knockdowns expressing GFP (KD + GFP), and Mfn2 knockdowns expressing siRNA-resistant Mfn2 (KD+Mfn2res). (B) Basal respiration rates of SSC + GFP, KD + GFP, and KD+Mfn2res cells were determined by using a mitochondrial stress test (n = 3). (C) The proliferation of SSC + GFP, KD + GFP, and KD+Mfn2res was assessed by manual cell counting after a 64 hr knockdown and 48 hr overexpression (n = 5). Data are presented as mean ±SEM. *p<0.05, **p<0.01, ***p<0.001.
Figure 3—figure supplement 2. Overexpression of Mfn2 in 3T3-L1 fibroblasts increases mitochondrial respiration and cellular proliferation.

Figure 3—figure supplement 2.

(A) Immunoblot analysis of Mfn2 in whole-cell lysates of control cells expressing GFP and cells expressing siRNA-resistant wildtype Mfn2 (Mfn2OE). (B) Basal respiration rates of GFP control cells and Mfn2OE cells were determined by using a mitochondrial stress test (n = 3). (C) The proliferation of GFP control cells and Mfn2OE cells was assessed by manual cell counting after a 48 hr overexpression (n = 4). Data are presented as mean ±SEM. *p<0.05, **p<0.01.
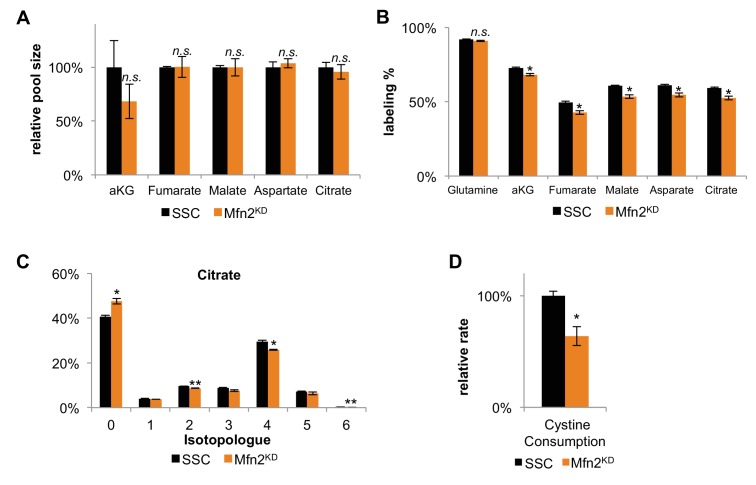
Figure 3—figure supplement 3. Decreased labeling percentages of TCA cycle intermediates and decreased cystine consumption in Mfn2 knockdowns (Mfn2KD) suggests a decrease in glutamine anaplerosis compared to scrambled siRNA controls (SSC).

Figure 3—figure supplement 3.

(A) The relative pool size of TCA cycle intermediates remained unchanged in Mfn2 knockdowns. The pool sizes were normalized by dry cell mass and internal standards (n = 3). (B) The labeling percentages of TCA cycle intermediates were significantly decreased in Mfn2 knockdowns. (C) The isotopologue distribution of citrate shows a similar pattern, but decreased labeling for all isotopologues. These changes imply a change in TCA cycle flux. (D) Relative change in cystine consumption rates for SSC and Mnf2 knockdowns (n = 3). Data are presented as mean ±SEM. *p<0.05, **p<0.01, n.s. not statistically significant.