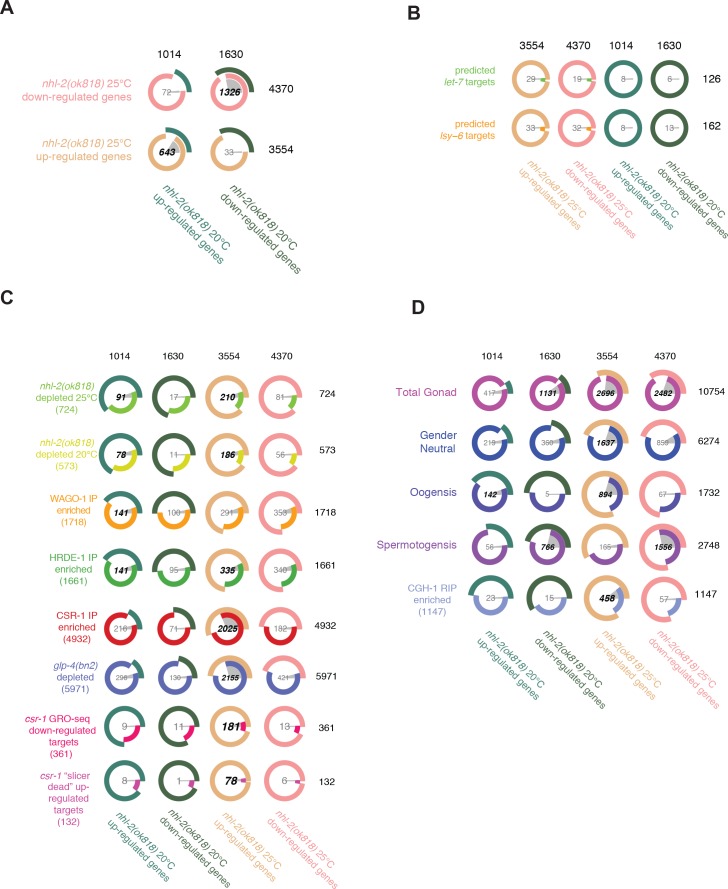
Figure 7. Analysis of the 22G-RNAs targeting the nhl-2(ok818) mRNA transcriptome.
(A) Venn-pie diagrams indicate the number of genes enriched in or depleted of 22G-RNAs in nhl-2(ok818) mutants relative to wild-type worms at 20°C and 25°C, as determined using EdgeR. Numbers in bold demonstrate statistically significant overlap. Each row corresponds to a gene set, with its label on the right. Each Venn-pie diagram indicates the overlap between the gene set of its row and the gene set whose label is in its column. (B) Venn-pie diagrams show comparisons between the predicted targets of the miRNAs let-7 and lsy-6 (determined using TargetScan6), and genes that are mis-regulated in nhl-2(ok818) mutants. (C) Venn-pie diagrams show comparisons between the genes depleted of 22G-RNAs in nhl-2(ok818) mutants and the genes enriched in 22G-RNAs in CSR-1, WAGO-1, or HRDE-1 IP samples with nhl-2(ok818) mRNA-seq data. (D) Venn-pie diagrams show comparisons between nhl-2(ok818) mRNA-seq data and genes depleted of 22G-RNAs in glp-4(bn2) mutants (which have very few germ cells) or germline expressed gene mRNA-seq data (Ortiz et al., 2014) (as in Figure 4B).

