Figure 2. Quorum sensing controls rapid, VpsL-independent aggregation of V. cholerae in liquid.
Aggregate formation of the LCD QS-locked (LCD-locked) (A), HCD QS-locked (HCD-locked) (B), and wild-type (WT) (C) V. cholerae strains after 22 h of growth. Shown are representative cross-sections through samples (A–C). The approximate extents of individual aggregates are indicated with white outlines. Magnification: 63X; scale bar: 50 μM. (D) Quantitation of total volume fraction, the total volume of the imaged region that is occupied by aggregates (Materials and methods) within the imaged region for ΔvpsL LCD-locked, ΔvpsL HCD-locked, and ΔvpsL WT strains after 22 h of growth. Representative cross-sections through the ΔvpsL LCD-locked (E–H), ΔvpsL HCD-locked (I–L), and ΔvpsL WT (M–P) V. cholerae strains at 16, 19, 22, and 25 h. (E–P) Magnification: 10X; scale bar: 250 μm. (Q) Quantitation of aggregate volume fraction. The data for T = 22 h are the same as those shown in Figure 2D. Triangle: ΔvpsL LCD-locked, circle: ΔvpsL HCD-locked, and diamond: ΔvpsL WT. (R) Average cluster volume over time for the ΔvpsL HCD-locked (circle) and ΔvpsL WT (diamond) strains. (D,Q,R) Quantitation of mean ± standard deviation (SD; N=3 biological replicates). Mean and SD were calculated using the untransformed data, not the log-transformed data, which results in asymmetric error bars. All strains in all panels harbor the fluorescent mKO reporter constitutively expressed from the chromosome.

Figure 2—figure supplement 1. V. cholerae aggregates form in liquid.

Figure 2—figure supplement 2. V. cholerae forms distinct aggregates.

Figure 2—figure supplement 3. Known Ca2+-related genes do not contribute to V. cholerae aggregation.

Figure 2—figure supplement 4. Known pili genes do not contribute to V. cholerae aggregation.

Figure 2—figure supplement 5. WT and ΔvpsL strains display similar aggregation kinetics.

Figure 2—figure supplement 6. V. cholerae aggregate formation is rapid.

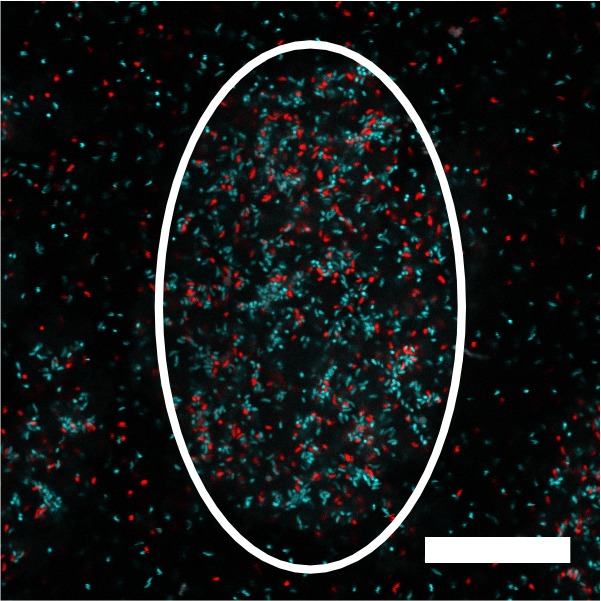
Figure 2—figure supplement 7. V. cholerae aggregate formation is non-clonal.