. 2018 Dec 24;7:e42057. doi: 10.7554/eLife.42057

Figure 3. Exogenous autoinducers drive V. cholerae aggregation and HapR is required.

Quantitation of aggregate volume fraction at 22 h for the ΔvpsL HCD QS-locked (HCD-locked), ΔvpsL LCD QS-locked (LCD-locked), CAI-1-responsive (± CAI-1), and AI-2-responsive (± AI-2 and boric acid) V. cholerae strains (A). Autoinducers or solvent controls were added at the time of inoculation. Concentrations used: CAI-1: 5 μM, AI-2: 1 μM, and boric acid: 100 μM. (B) Quantitation of aggregate volume fraction (black bars) and bioluminescence (gray bars) at 22 h for the CAI-1-responsive strain to which CAI-1 was added at T = 0 h and from 3 to 8 h at 1 h intervals. Also shown is bioluminescence quantified in a CAI-1-responsive strain harboring the cosmid pBB1 which carries the luxCDABE genes. RLU denotes relative lights units, defined as counts/min mL−1 per OD600. In A and B aggregate volume fraction was quantified in a strain harboring mKO constitutively expressed from the chromosome; quantitation of mean ± standard deviation (SD) (N=3 biological replicates). Representative cross-sections of the ΔvpsL HCD-locked (C), ΔvpsL ΔaphA HCD-locked (D), ΔvpsL ΔhapR HCD-locked (E), ΔvpsL ΔaphA ΔhapR HCD-locked (F), ΔvpsL LCD-locked (G), ΔvpsL ΔaphA LCD-locked (H), ΔvpsL ΔhapR LCD-locked (I), and ΔvpsL ΔaphA ΔhapR LCD-locked (J) V. cholerae strains following 22 h of growth. (C–J) Magnification: 10X; scale bar: 250 μm. All strains harbor mKO constitutively expressed from the chromosome. (K) Quantitation of aggregate volume fraction for samples in C–J. Shown are mean ± SD (N=3 biological replicates). The ΔvpsL ΔaphA LCD-locked strain appears to exhibit modest aggregation (H), possibly due to AphA repression of hapR transcription (Rutherford et al., 2011), but the level of aggregation is below the detection threshold employed in the segmenting analysis (K).

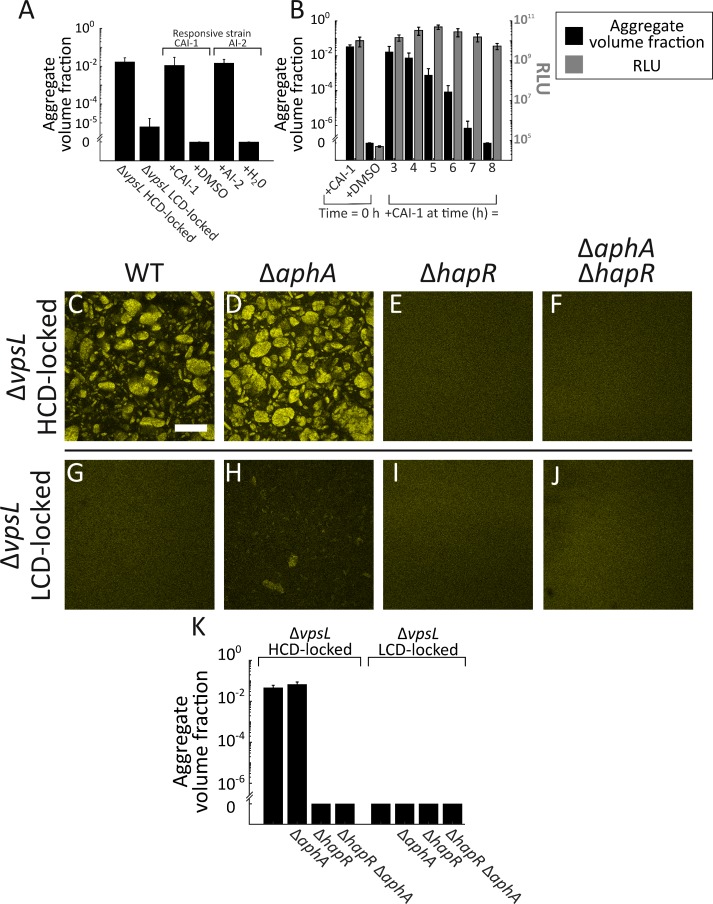
Figure 3—source data 1. Figure source data.
elife-42057-fig3-data1.xlsx (301.8KB, xlsx)
DOI: 10.7554/eLife.42057.025

Figure 3.

Figure 3—figure supplement 1. Autoinducer supplementation drives V. cholerae aggregation via the cognate QS receptor.

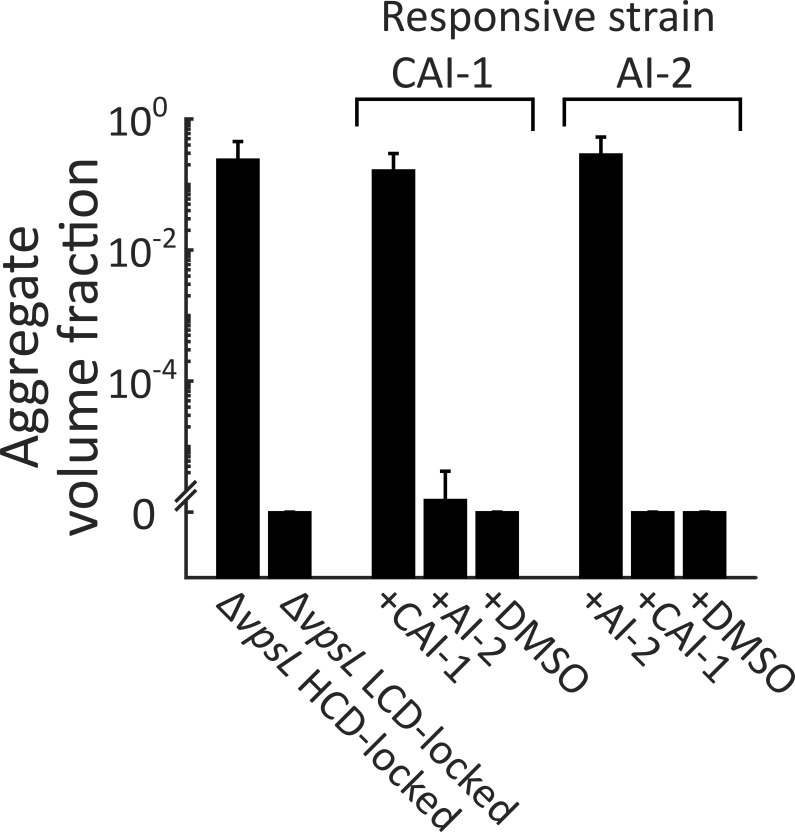
Figure 3—figure supplement 1.

Quantitation of aggregate volume fraction at 22 h following inoculation of ΔvpsL HCD QS-locked (HCD-locked), ΔvpsL LCD QS-locked (LCD-locked), CAI-1-responsive, and AI-2-responsive strains. Nothing was added to the parent control strains and CAI-1 (5 μM), AI-2 (1 μM, and 100 μM boric acid), or DMSO solvent was added at T = 0 h to both the CAI-1-responsive and AI-2-responsive strains. All strains harbor mKO constitutively expressed from the chromosome. All error bars are mean ± standard deviation (N=3 biological replicates).
Figure 3—figure supplement 1—source data 1. Figure source data.
DOI: 10.7554/eLife.42057.018
Figure 3—figure supplement 2. Autoinducer supplementation drives V. cholerae aggregation in the presence of vpsL, cqsR, and vpsS.

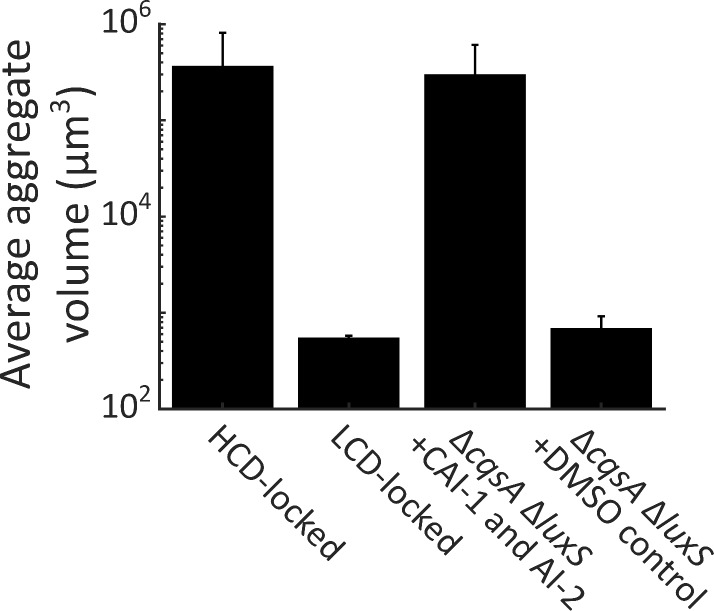
Figure 3—figure supplement 2.

Quantitation of aggregate size distribution for HCD QS-locked (HCD-locked), LCD QS-locked (LCD-locked), and ΔcqsA ΔluxS V. cholerae strains supplemented with both CAI-1 (5 μM) and AI-2 (1 μM and 100 μM boric acid), or DMSO, as designated. All strains have the vpsL, vpsS, and cqsR genes present. LCD-locked and ΔcqsA ΔluxS (without autoinducers) strains were quantified with a 63X water immersion objective, while HCD-locked and ΔcqsA ΔluxS (with autoinducers) strains were quantified with a 10X air objective. All strains harbor mKO constitutively expressed from the chromosome. All error bars are mean ± standard deviation (N=3 biological replicates).
Figure 3—figure supplement 2—source data 1. Figure source data.
DOI: 10.7554/eLife.42057.020
Figure 3—figure supplement 3. Late-time autoinducer supplementation does not delay the onset of aggregation.

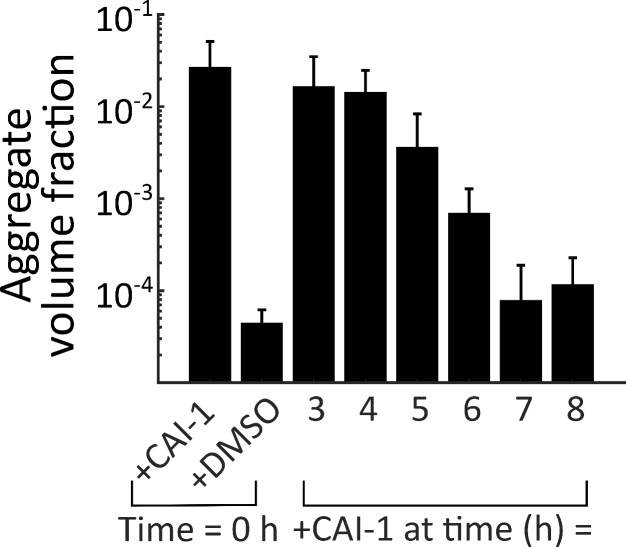
Figure 3—figure supplement 3.

Quantitation of aggregate volume fraction at 46 h (samples are the same as in main text Figure 3B, grown for an additional 24 h) of the CAI-1-responsive strain to which CAI-1 was added at T = 0 h and from 3 to 8 h at 1 h intervals. The strain harbors mKO constitutively expressed from the chromosome. All error bars are mean ± standard deviation (N=3 biological replicates).
Figure 3—figure supplement 3—source data 1. Figure source data.
DOI: 10.7554/eLife.42057.022
Figure 3—figure supplement 4. Complementation of hapR in aggregate formation.

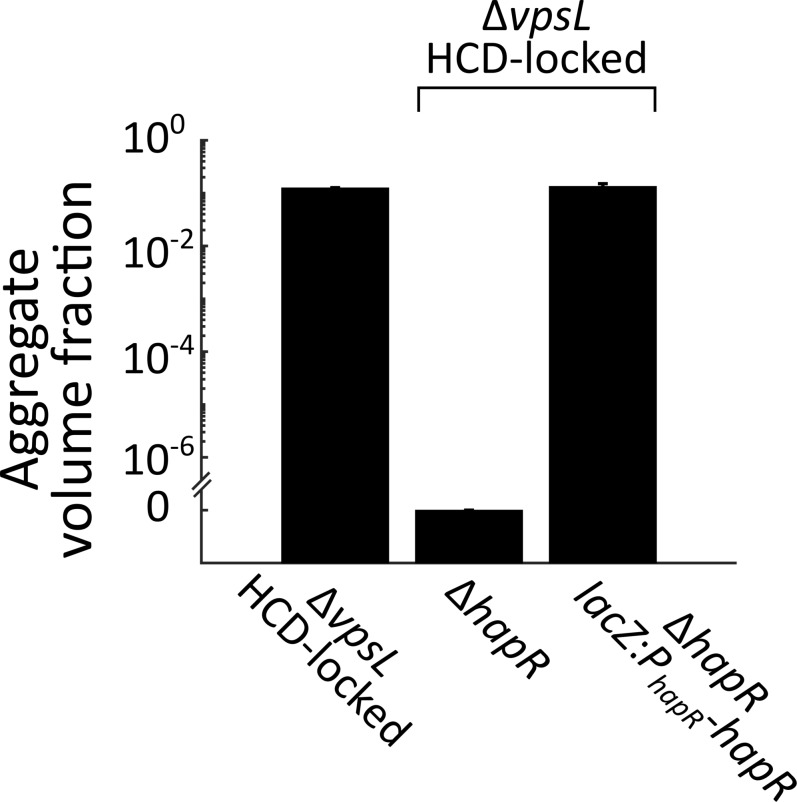
Figure 3—figure supplement 4.

Quantitation of aggregate volume fraction at 22 h for ΔvpsL HCD-locked, ΔvpsL ΔhapR HCD-locked, ΔvpsL ΔhapR lacZ:PhapR-hapR HCD-locked strains. All error bars are mean ± standard deviation (N=3 biological replicates).
Figure 3—figure supplement 4—source data 1. Figure source data.
DOI: 10.7554/eLife.42057.024