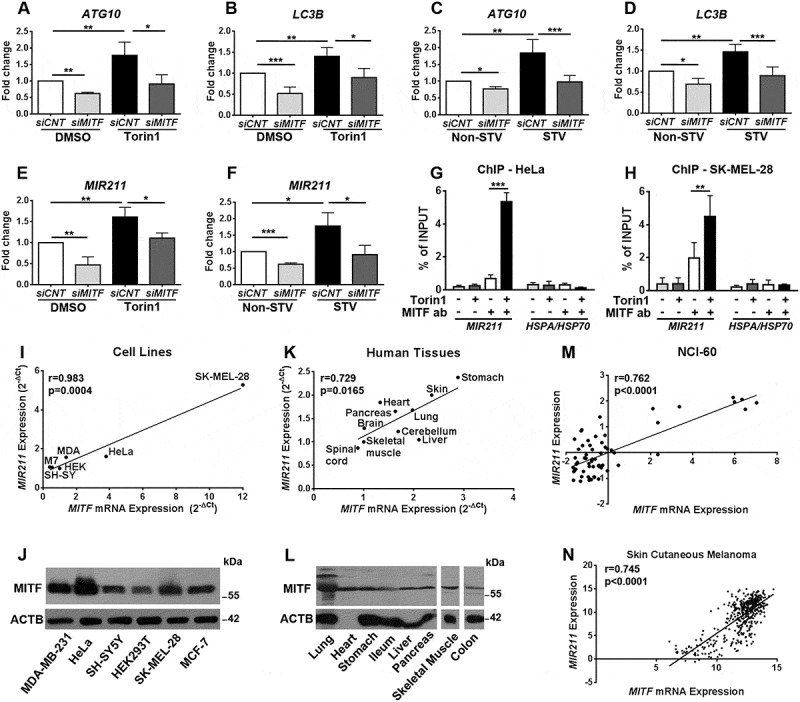
Figure 2.

MITF regulated expression levels of autophagy-related genes and MIR211. (a-d) RT-qPCR analysis of mRNA levels of ATG10 (a and c) and LC3B (b and d) in control siRNA (siCNT)- or siMITF-transfected HeLa cells following torin1 (a and b) or starvation (c and d) treatment (mean± SD of n = 5 independent experiments ***p < 0.01, **< 0.03, *p < 0.05). DMSO, carrier control. Data were normalized to GAPDH. (e) TaqMan RT-qPCR analysis of MIR211 expression in DMSO or torin1-treated HeLa cells (mean± SD of n = 3 independent experiments, **p < 0.03, *p < 0.05). Data were normalized to RNU6-1 (RNA, U6 small nuclear 1) (U6). (f) TaqMan RT-qPCR analysis of MIR211 expression in non-starved (Non-STV) or starved (STV) HeLa cells (mean± SD of n = 3 independent experiments, ***p < 0.01, *p < 0.05). Data were normalized to RNU6-1. (g and h) ChIP assays showing specific association of MITF with the MIR211 promoter region in HeLa (G) and SK-MEL-28 (H) cells under DMSO or torin1-treated conditions. qPCR results of MIR211 promoter primers were obtained from input (pre-IP) samples or following ChIP with MITF antibodies. Ct (threshold cycle) ratios were normalized (CtChIP/Ctinput). In control (CNT) ChIP experiments, no antibody was added. HSPA/HSP70 promoter primers were used as negative control (mean± SD of n = 3 independent experiments, ***p < 0.01, **p < 0.03). (i) Correlation of endogenous MIR211 and MITF mRNA levels in various cell lines. A positive correlation between endogenous MIR211 and MITF mRNA levels was determined by RT-qPCR in MDA-MB-231 (MDA), MCF-7 (M7), SH-SY5Y (SH-SY), HEK293T (HEK), HeLa and SK-MEL-28 cells. r, Pearson’s correlation coefficient. (r > 0, positive correlation; p value = 0.004). (j) Expression of MITF protein was detected in MDA-MB-231, HeLa, SH-SY5Y, HEK293T, SK-MEL-28, MCF-7 cells using a pan-MITF antibody. (k) Correlation of endogenous MIR211 and MITF mRNA levels in human tissues from 4 different cadavers. A positive correlation between endogenous MIR211 and MITF mRNA levels was determined by RT-qPCR in the indicated tissues (Pearson’s r coefficient (r) = 0.729, p value (p) = 0.0165). (l) Immunoblot analysis of tissue protein extracts from a cadaver using a pan-MITF antibody. ACTB was used as loading control. (m and n) The correlation between miRNA and gene expression profile is quantified by computing the correlation coefficient using the NCI-60 expression profiling data (m) (Pearson’s r coefficient (r) = 0.762, p value (p)< 0.0001) and TCGA Skin Cutaneous Melanoma (n) (Pearson’s r coefficient (r) = 0.745, p value (p)< 0.0001) microRNA and gene expression data.
