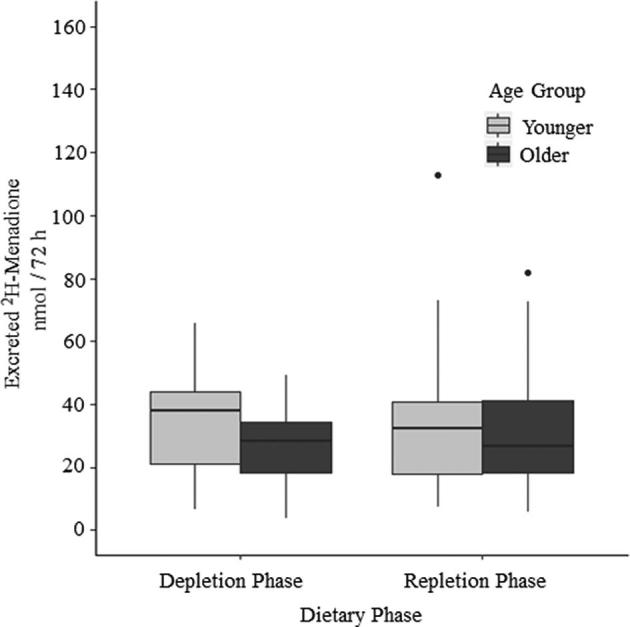
FIGURE 3.

Box and whisker plot of total 2H-menadione excretion (nmol/72 h) by dietary phase and age group. Excretion of 2H-menadione in urine was not significantly different by phase or age group. Bold central lines represent the median for each age group; lower and upper hinges represent the first and third quartiles, respectively. Whiskers extend to the furthest point within 1.5 × IQR, and dots represent data points beyond 1.5 × IQR. Sexes within age groups are combined (depletion phase: n = 19 older, n = 21 younger; repletion phase: n = 20 older, n = 21 younger).
