
Figure 2.
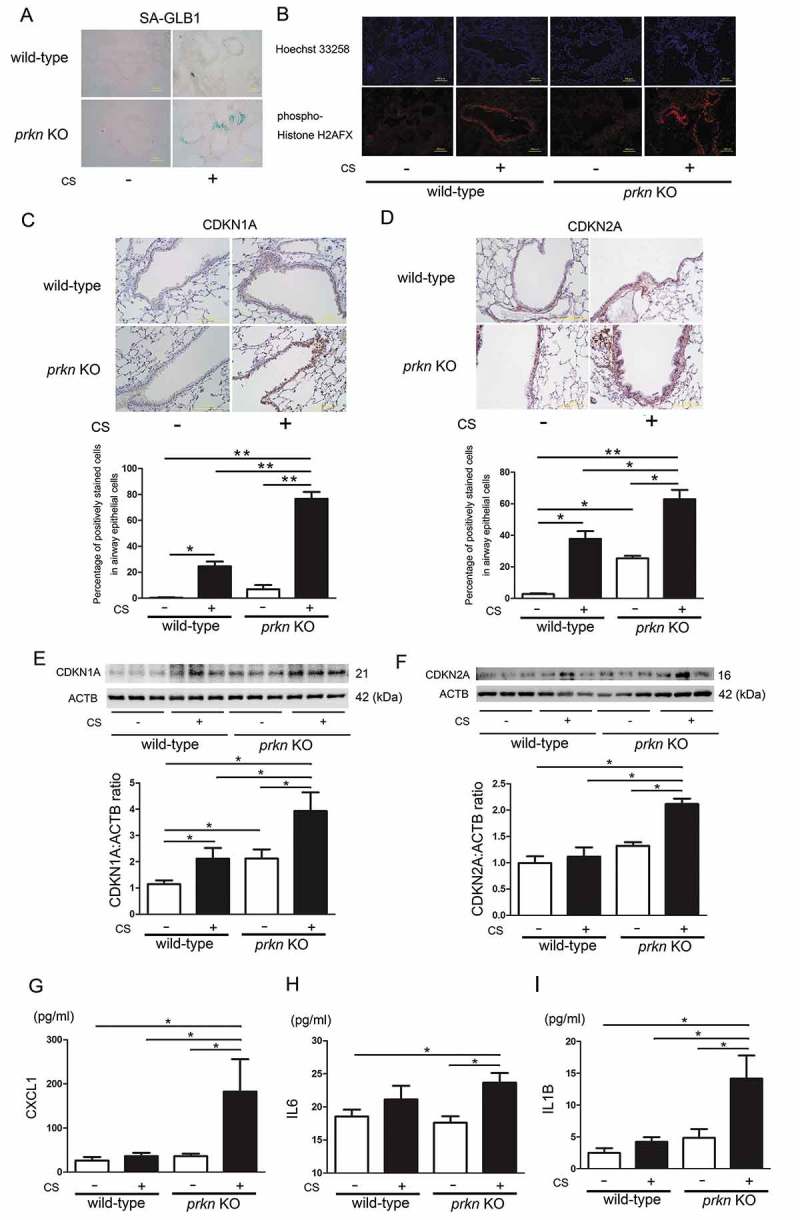
Long-term cigarette smoke exposure induces accelerated cellular senescence in prkn knockout mice. (a) Photomicrographs of GLB1 staining of control-air- and CS-exposed mouse lungs. (b) Photographs of immunofluorescent staining of phospho-Histone H2AFX (Ser139) in control-air- and CS-exposed mouse lungs. Bar: 100 µm. (c) Immunohistochemical staining of CDKN1A in control-air- and CS-exposed mouse lungs. Bar: 100 µm. The lower panel is the percentage (average ± SEM) of positively stained airway epithelial cells. *P < 0.05, **P < 0.001, by ANOVA and Tukey post-hoc test. (d) Immunohistochemical staining of CDKN2A in control-air- and CS-exposed mouse lungs. Bar: 100 μm. The lower panel is the percentage (average ± SEM) of positively stained airway epithelial cells. *P < 0.05, **P < 0.001, by ANOVA and Tukey post-hoc test. (e) WB using anti- CDKN1A and anti-ACTB antibodies, of lung homogenates from control-air- and CS-exposed mice for 6 months. The lower panel is the average (±SEM) taken from densitometric analysis of WB. Treatment groups were composed of control-air-exposed wild-type mice (n = 10), CS-exposed wild-type mice (n = 9), control-air-exposed prkn KO mice (n = 8), CS-exposed prkn KO mice (n = 9) *P < 0.05, by ANOVA and Tukey post-hoc test. All groups exposed for 6 months. (f) WB using anti- CDKN2A and anti-ACTB antibodies, of lung homogenates from control-air- and CS-exposed mice. The lower panel is the average (±SEM) taken from densitometric analysis of WB. Treatment groups were composed of control-air-exposed wild-type mice (n = 9), CS-exposed wild-type mice (n = 9), control-air-exposed prkn KO mice (n = 8), CS-exposed prkn KO mice (n = 9) *P < 0.05, by ANOVA and Tukey post-hoc test. (g) ELISA showing CXCL1 in lung homogenates from control-air- and CS-exposed mice. Shown is the average (±SEM). *P < 0.05, by ANOVA and Tukey post-hoc test. (h) ELISA showing IL6 in lung homogenates from control-air- and CS-exposed mice. Shown is the average (±SEM). *P < 0.05, by ANOVA and Tukey post-hoc test. (i) ELISA showing IL1B in lung homogenates from control air and CS-exposed mice. Shown is the average (±SEM). *P < 0.05, by ANOVA and Tukey post-hoc test.