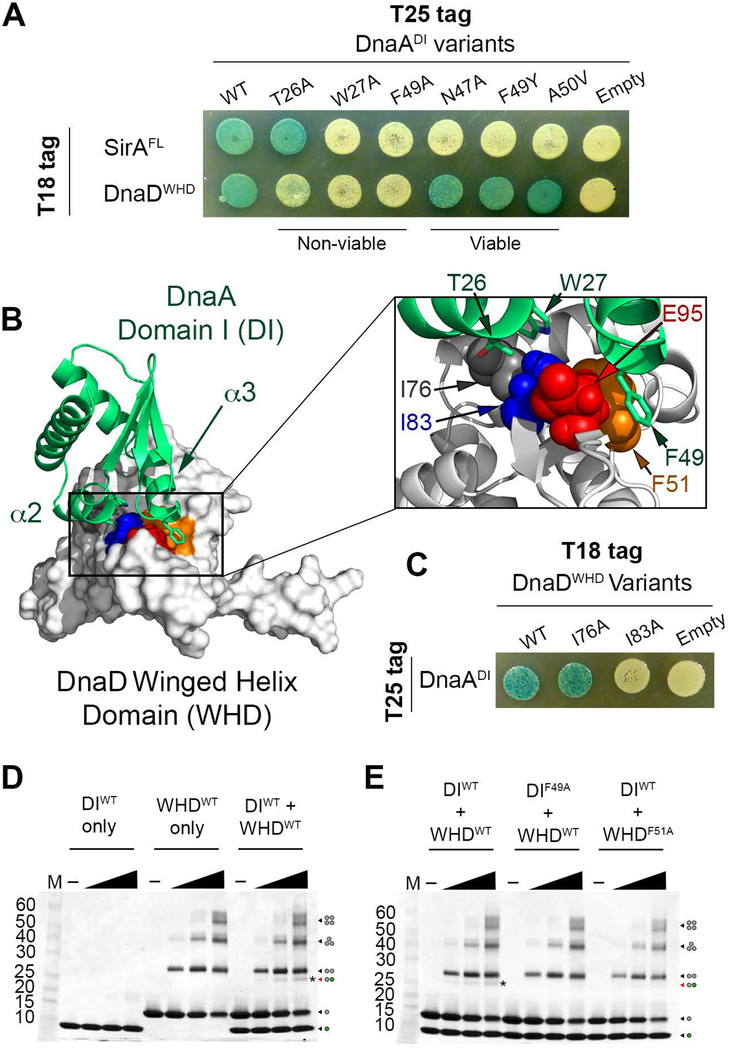
Figure 5. DnaDWHD Binds to the DnaADI hot spot.
(A) B2H of T25-tagged DnaADI variants co-expressed with T18-tagged SirA or DnaDWHD. “Viable” and “non-viable” refer to the effect these DnaA variants have when introduced into B. subtilis. (B) Model of the DnaDWHD and DnaADI complex. DnaADI is represented as a green ribbon diagram with α2 and α3 labeled, while DnaDWHD is shown as a white surface. The conserved residues that line the binding cleft in DnaDWHD are colored with F51 in orange, I83 in blue, and E95 in red. The boxed inset shows a zoomed view of the interaction interface with the DnaDWHD F51, I83 and E95 sidechains shown as spheres. DnaDWHD I76 is also shown and colored in grey. The DnaADI interacting residues (T26, W27 and F49) are shown as green sticks with oxygen atoms colored red and nitrogen atoms colored blue. (C) B2H of T25-tagged DnaADI co-expressed with T18-tagged DnaDWHD variants. (D) SDS-polyacrylamide gel stained with coomassie blue showing the glutaraldehyde crosslinking of the wild type DnaD winged helix domain (WHDWT) and DnaA domain I (DIWT). The dots at the right hand side of the gel show the oligomeric state of each band with the grey dots symbolizing DnaD and the green dots symbolizing DnaA. The band representing the complex is further distinguished with an asterisk. (E) SDS-polyacrylamide gel stained with coomassie blue showing the glutaraldehyde crosslinking of a variant of the DnaD winged helix domain (WHDF51A) or DnaA domain I (DIF49A) that cannot interact in a B2H assay. The band representing the complex is marked by an asterisk.

