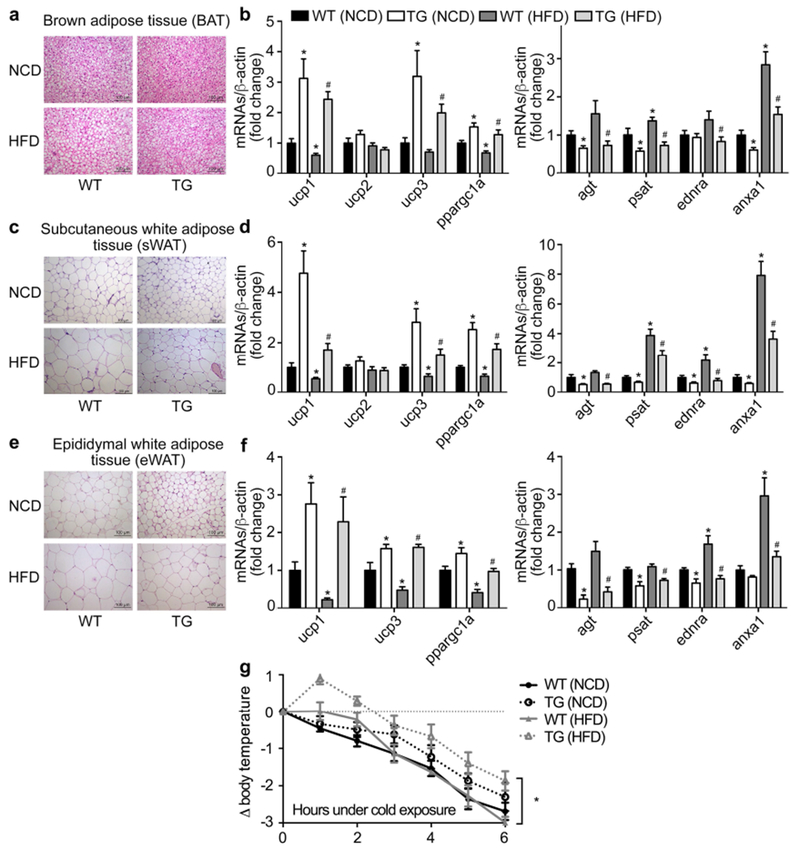
Figure 5. Activation of mTOR signaling in X/A-like cells increases brown phenotype of BAT and WAT depots.

Histology of BAT (a), sWAT (c) and eWAT (e) shown by HE staining. mRNA levels of brown- and white- adipocyte marker genes were detected by RT-qPCR in BAT (b), sWAT (d) and eWAT (f), and normalized to β-actin. Fold changes were expressed as mean±SEM. n=20 for each group. *P<0.05 vs. wild-type mice fed NCD; # P<0.05 vs. wild-type littermates fed HFD (Student’s t test). Mice were placed in cold room (4°C) for 6 hours and rectal temperature was measured every hour (g). n=6 per group. *P<0.05 indicates TG vs. wild-type mice fed HFD.
