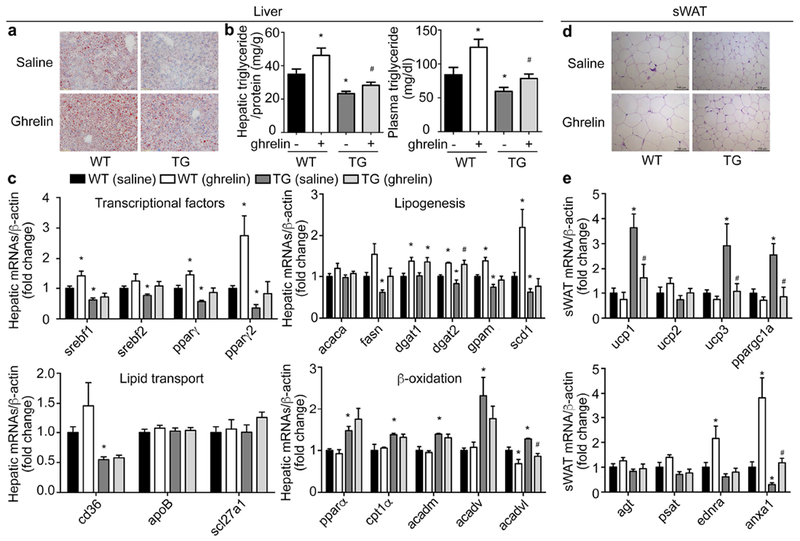
Figure 6. Effects of ghrelin supplementation in TG mice.

Wild-type littermates (WT) and TG mice were fed HFD for 12 weeks and administered acyl-ghrelin (11nmol/kg/day) for 2 weeks through a subcutaneous osmotic mini-pump. Levels of mRNAs were determined by RT-qPCR and normalized to β-actin. Fold changes were expressed as means±SEM. n = 10 for each group. *P<0.05 vs. WT (saline), # P<0.05 vs. TG (saline)).
a. Oil-red O staining.
b. Hepatic and circulating triglyceride content measured by colorimetric assay.
c. Hepatic mRNA levels of lipogenesis-, lipid transport- and β-oxidation-related genes.
d. Representative H&E staining of subcutaneous white adipose tissue (sWAT).
e. mRNAs levels of brown- or white- marker genes in sWAT.
