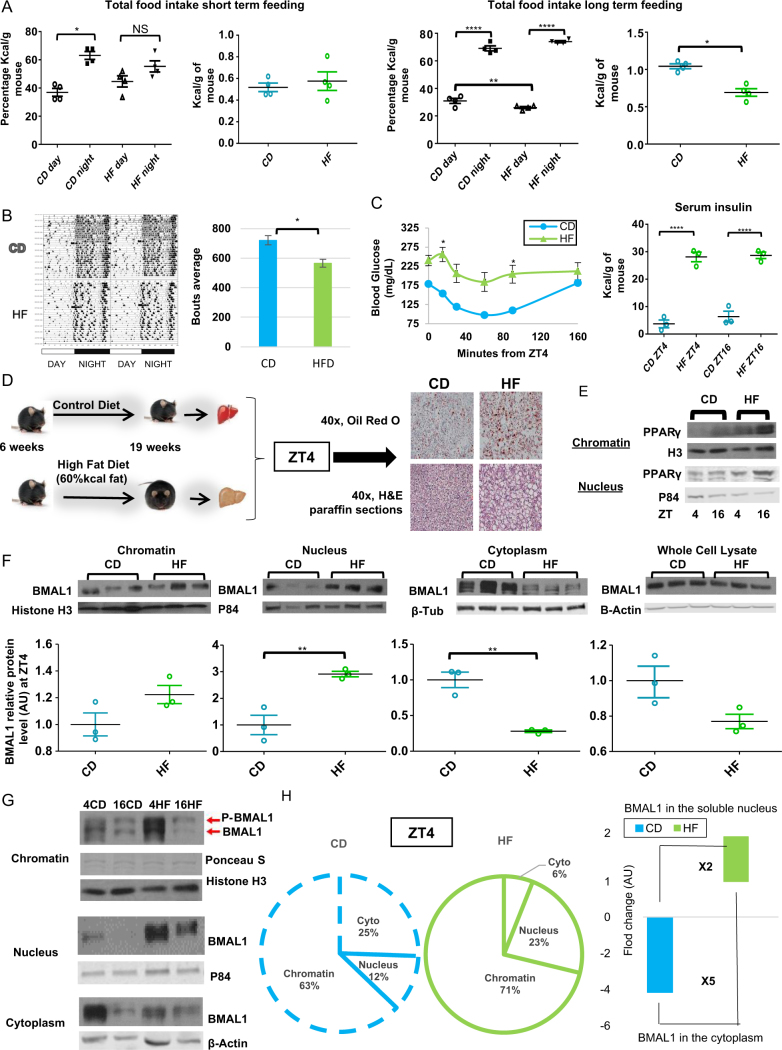
Fig. 1.
Adaptation to high fat (HF) diet restores circadian energy intake. a Quantification of food intake (n = 4) after transient (left panels) and chronic (right panels) CD and HF feeding. Significance (p < 0.05) was determined by Mann–Whitney U-test (transient intake and right panel for chronic intake) and two-way ANOVA followed by Tukey’s post-hoc test (left panel, chronic intake). b Actograms (n = 8) reveal home cage activity of animals on CD and HF (left panel). Quantification, right panel. Significance (p < 0.05) was determined by Mann–Whitney U-test. c Circulating glucose levels (n = 8) measured during an IP insulin tolerance test (left panel). Serum insulin levels of CD (n = 3) and HF (n = 4) mice, right panel. Significance (p < 0.05) was determined by two-way ANOVA followed by Tukey’s post-hoc test. d Model of diet-induced obesity (DIO) (left panel) and Oil Red O and H&E staining from DIO mouse livers (right panel) at ZT4. e Western blot reveals diurnal expression of Pparγ in the chromatin and soluble nuclear compartments of CD and HF animals. f Western blot reveals compartmentalization of hepatic BMAL1, as well as levels in whole cell lysates of individual animals (n = 3) at ZT4 undergoing prolonged HF feeding compared to CD. Western blot quantification in arbitrary units (AU), lower panels. Significance (p < 0.05) was determined by unpaired Student’s t-test. f Western blotting reveals compartmentalization of BMAL1 in the liver of animals at ZT4 and ZT16 after chronic CD and HF. g Pie charts, normalized by the total BMAL1 levels in the whole cell lysates, express changes in BMAL1 subcellular localization after chronic CD vs. HF feeding (left panel). Representation of the fold change in cytoplasmic and nuclear BMAL1 under CD and HF feeding (right panel). *p < 0.05, **p < 0.01, ***p < 0.001, ****p < 0.0001

