Figure 4.

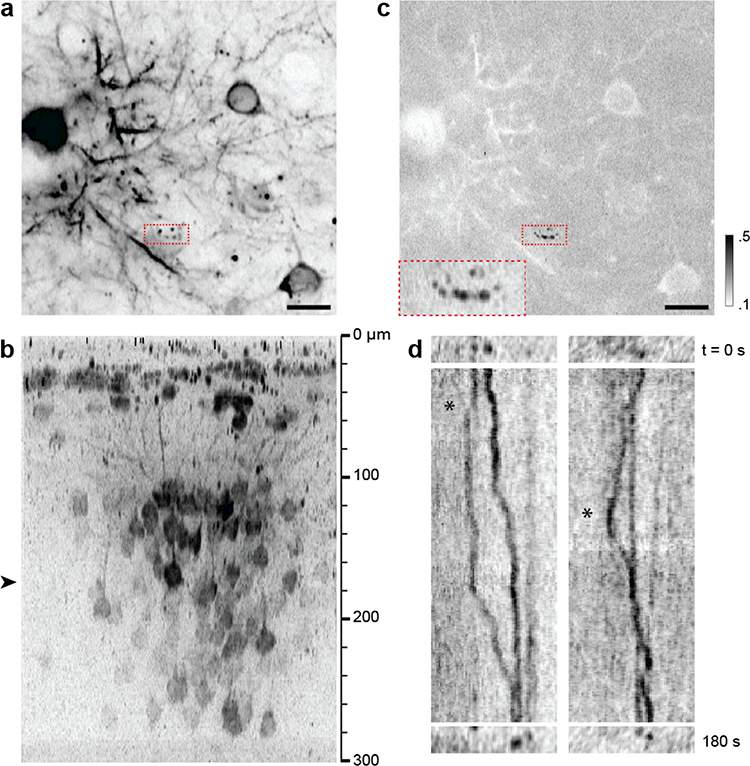
Cytoplasmic mRNAs in the live brain visualized with LV-Syn-MCP-mKate2 (without NLS). (a) Lateral section showing mobile mRNA particles (red dashed box). Scale bar, 15 μm. (b) Axial cross section where the approximate depth of (a) is denoted with an arrowhead. (c) The coefficient of variation of the region distinguishes mobile and stationary mRNA species (black and white, respectively). Inset: A magnified view of the red dashed box revealing hotspots where mRNAs pause. (d) Kymographs of mRNA particles showing reversal of directions (asterisks, see Movie 1).
