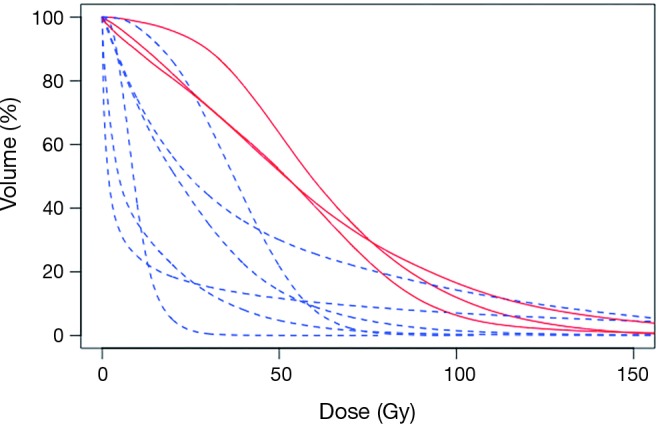
Figure 2.

Dose volume histograms for the normal hepatic parenchyma for the treated lobe for 10 patients who underwent assessment of post-radioembolization dosimetry. DVHs for patients with hepatic toxicity are shown in red (solid line) and for patients without toxicity are shown in blue (dashed line). Qualitatively, patients who had greater liver volumes receiving 30–90 Gy were more likely to have toxicity.
