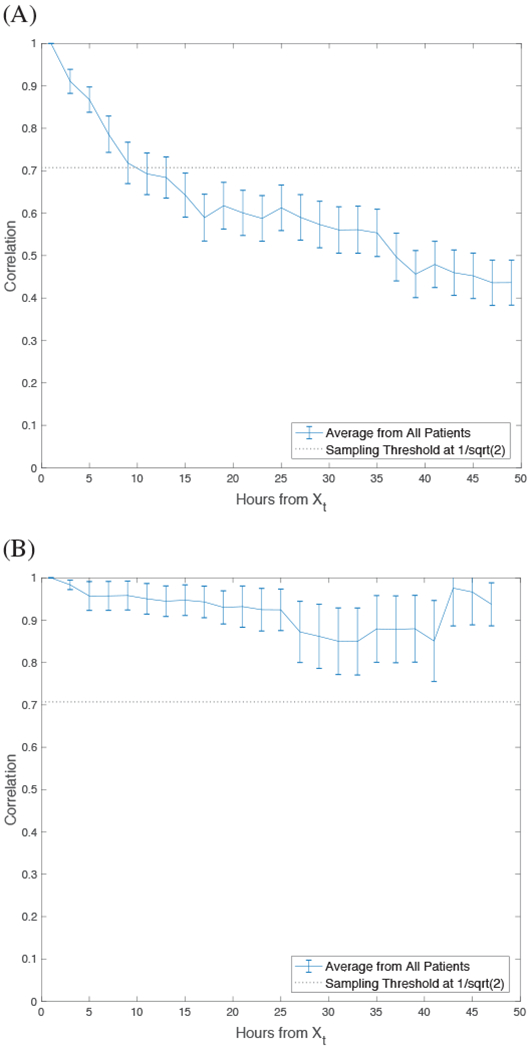
Fig. 6:

Average decay of correlation from all patients during (A) negative diagnosis of ARDS and (B) positive diagnosis of ARDS. Error bars represent standard error of the mean and each point represents correlation in relation to time (hours) from the initial observation sampled on each patient.
