
FIGURE 2.
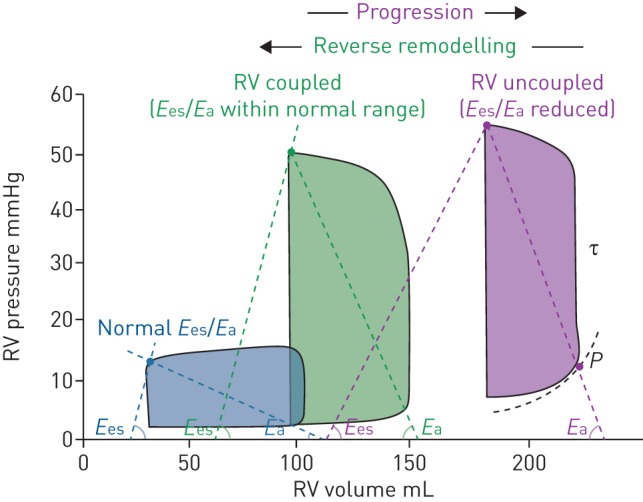
Right ventricular (RV) pressure–volume analysis. Pressure–volume loops at three different stages: normal (blue), pulmonary hypertension (green) and right ventricular failure (purple). Ees: end-systolic elastance; Ea: arterial elastance; τ: time constant of ventricular relaxation. P=α(eβV−1) describes the diastolic pressure–volume relation. Reproduced and modified from [11] with permission.