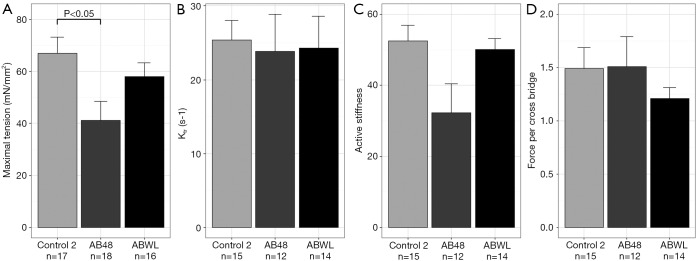
Figure 4.
Diaphragm fiber contractility. Contractility measurements of individual diaphragm fibers. (A) Maximal tension, which is the absolute maximal force normalized to fiber cross-sectional area, was significantly lower in fibers of the AB48 group compared to control fibers; (B) there were no changes in the rate constant of force redevelopment (ktr) indicating that the fraction of strongly bound cross bridges was unaltered; (C) active stiffness was not statistically different between the groups; (D) the force generated per cross bridge (i.e., the ratio of maximal tension and active stiffness) was not different between the groups. Values are presented as mean and error bars represent standard error of the mean. In each group diaphragm fibers of three mice were assessed. Numbers below the graphs are total numbers of fibers analyzed.

