
Figure 5.
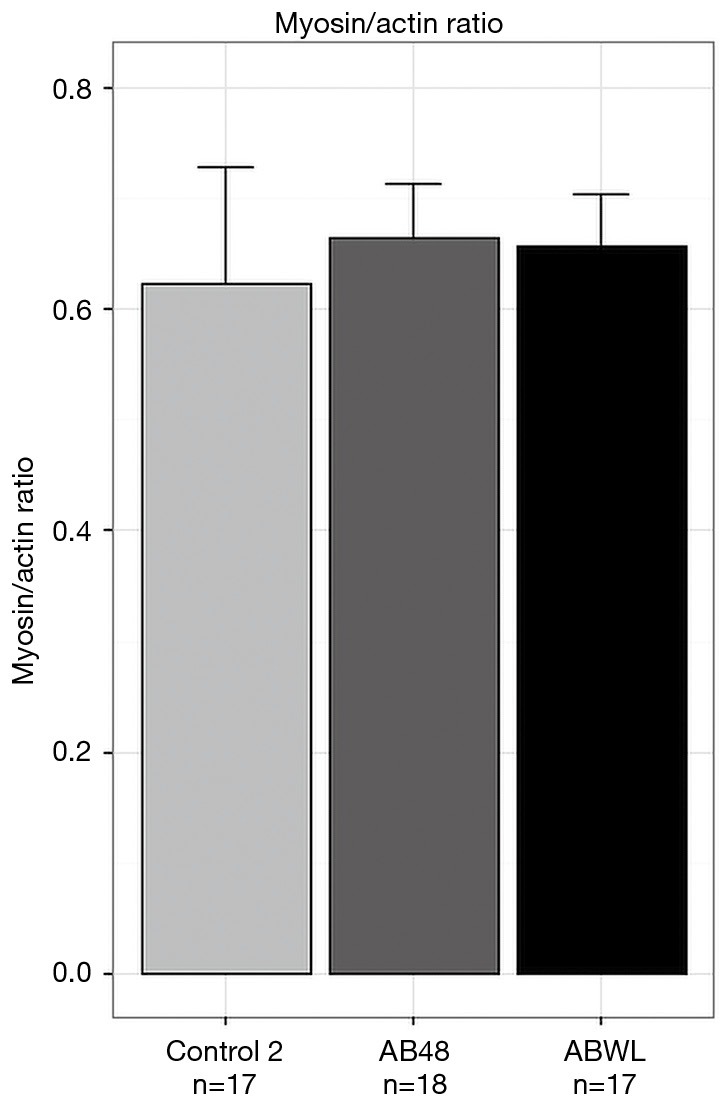
Myosin/actin ratios. Myosin/actin ratio of diaphragm fibers determined by western blot showed no differences between the groups. Values are presented as mean and error bars represent standard error of the mean. In each group diaphragm fibers of three mice were assessed. Numbers below the graphs are total numbers of fibers analyzed.