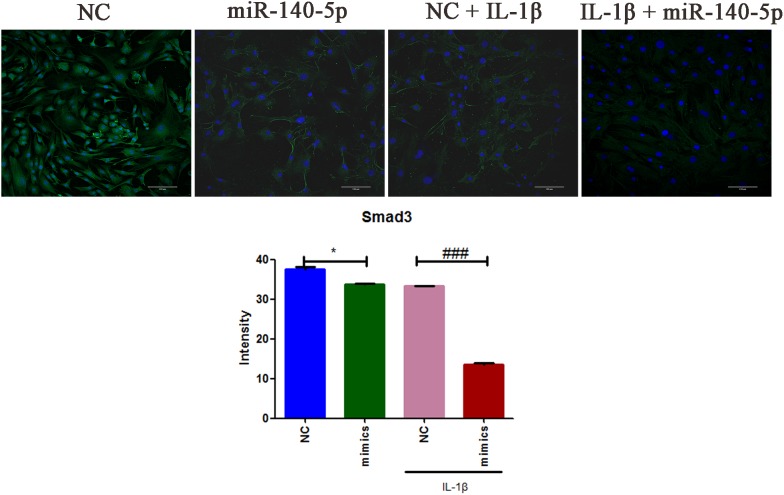
FIGURE 3.
The immunofluorescence intensities analysis of Smad3 expression in MCCs. MCCs were transfected with or without miR-140-5p mimic for 48 h, then stimulated with or without IL-1β for 24 h, respectively. Scale bar = 10 μm (magnification, ×200). Typical confocal micrographs of Smad3 showed in green, and DAPI in blue. Data are represented as means ± standard deviation (n = 3). ∗P < 0.05 when compared with the negative control group (NC). ###P < 0.001 when compared with NC induced by IL-1β.

