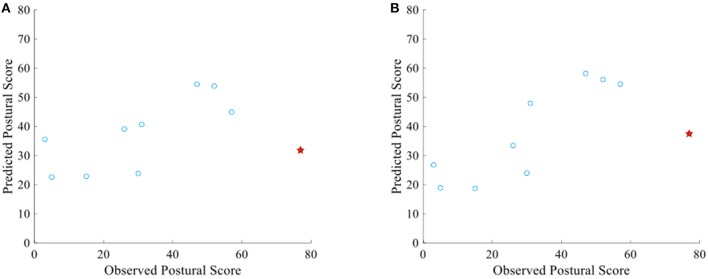
Figure 4.
(A) Scatter plot between observed and predicted postural score of RIL patients using all the oculomotor biomarkers mentioned in Table 2 (RMSE = 0.2). (B) Scatter plot between observed and predicted postural score using only the selected oculomotor biomarkers mentioned in Table 5 (RMSE = 0.16). Both graphs contain an outlier prediction which increases the RMSE significantly (Red star).

