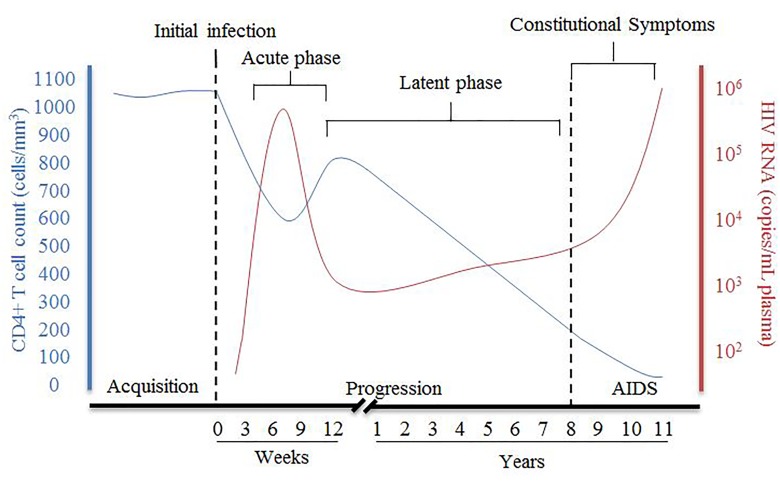
FIGURE 1.
Summary of pathogenesis of HIV infection in the presence of combined antiretroviral therapy. The disease progression of HIV in this figure is represented by the relative CD4+ T cell count in cells/mm3 (blue) and HIV viral RNA in copies/mL plasma (red) and their relationship during HIV from acquisition to the development of AIDS [Figure was adapted from An and Winkler (2010)].

