
Fig. 1.
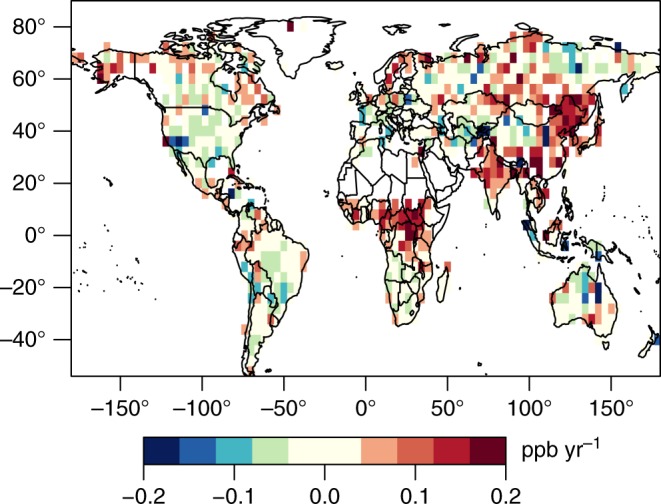
Trend in nadir GOSAT observations. The figure displays the trend between September 2009 and September 2015 minus the trend in the NOAA global marine observations. The GOSAT observations are averaged into 2.0° × 2.5° latitude–longitude boxes before fitting the trend, and the figure only displays boxes with more than 250 total observations. Red colors indicate that the GOSAT observations are increasing faster than the NOAA global marine average while green and blue colors indicate an increase slower than the NOAA average. China, India, tropical Africa, and tropical Asia show increases that are faster than the global average