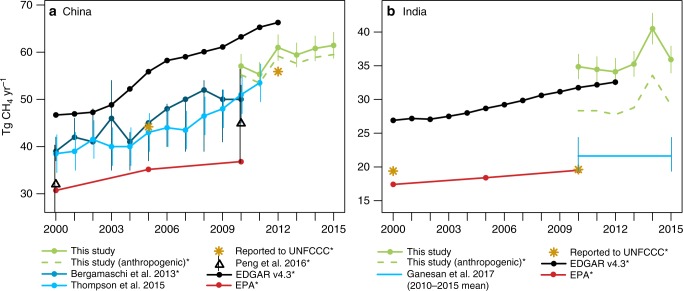
Fig. 2.
Methane emissions estimates for China and India. a CH4 emissions estimates for China from this study, Bergamaschi et al.10, Thompson et al.12, UNFCCC35, Peng et al.6, the EDGAR v4.3 inventory4, and the US EPA9; and b for India from this study, Ganesan et al. 28, UNFCCC53, and US EPA9. We find a trend in emissions from both countries for 2010–2015, though the trend for India is uncertain. Note that uncertainty estimates for this study are 95% confidence intervals, and uncertainty bounds for Bergamaschi et al.10 reflect the range of different inversions that use different datasets (e.g., in situ, satellite). Estimates marked with an asterisk are for anthropogenic emissions only. Furthermore, the dashed green line represents the posterior emissions estimate after subtracting the wetland emissions model, biomass burning inventory (GFED), and termite emissions

