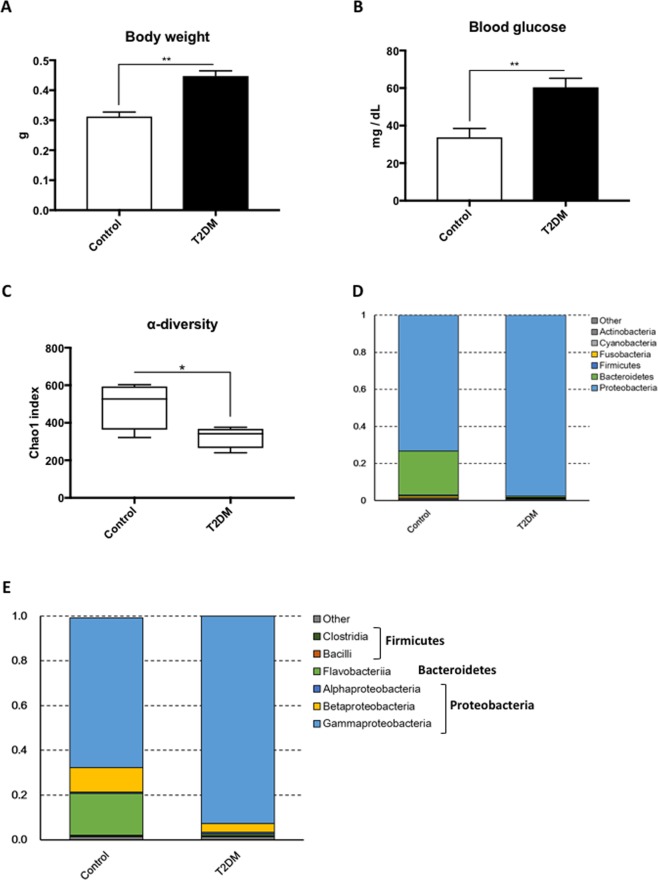
Figure 1.
Microbiome in T2DM zebrafish. (A) Body weight gain after 4-weeks of feeding experiment. The T2DM (overfed) group had increased body weight compared to the control group. **p < 0.01, n = 10. (B) Fasting blood glucose (FBG) after the 4-week feeding experiment. The T2DM group exhibited higher FBG compared to the control group. **p < 0.01, n = 5. (C) α-diversity analysis. Whiskers in the boxplot represent minimum and maximum α-diversity values within each group. **p < 0.01, n = 4. (D,E) Median relative abundance of dominant bacteria at phylum level (D) and class level (E).

