
Fig. 5.
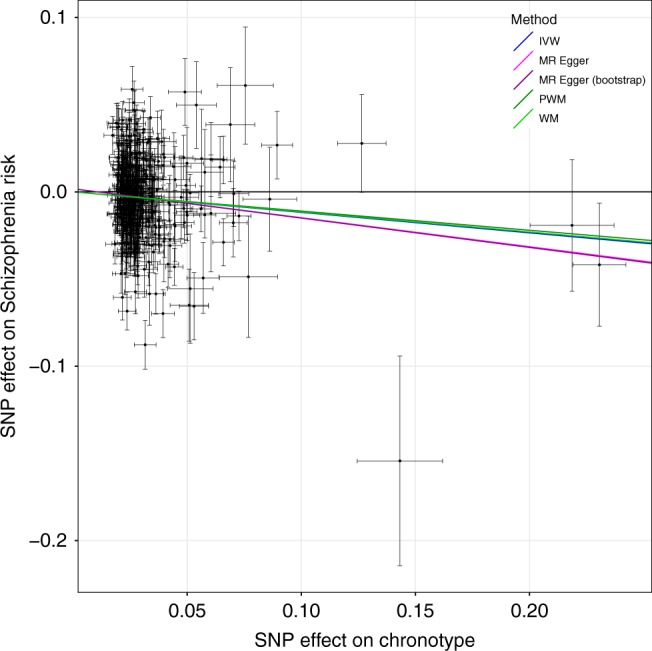
MR scatter plot of schizophrenia risk vs. chronotype exposure. Plot shows chronotype meta-analysis variants and their effects (log odds ratios) on schizophrenia risk in the PGC GWAS77 (outcome) versus odds of being a morning person (exposure). Lines identify the slopes of the five methods tested. Log odds (and SEs) for morningness were taken from the secondary effect-size meta-analysis. Error bars represent standard errors of effect sizes