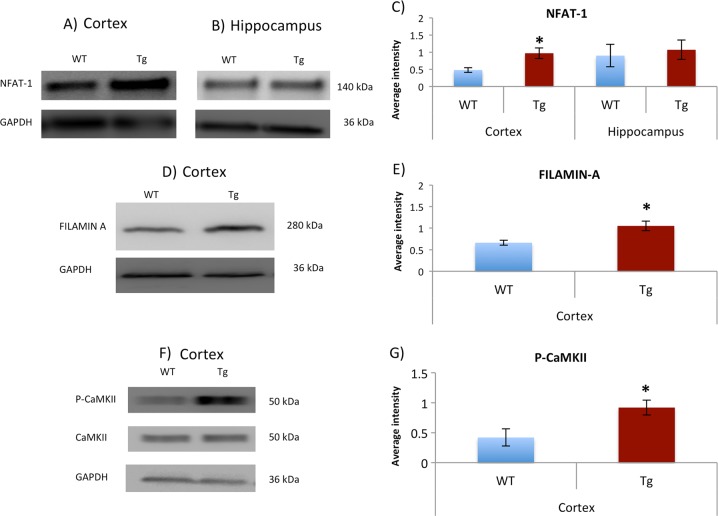
Fig. 4. Significant increase of NFAT-1, FILAMIN-A, and P-CaMKII in cortex of P301S mice (Cor-Tg) compared to WT (Cor-WT).
Immunoblotting analysis of NFAT-1 in (a) cortex and (b) hippocampus, (d) FILAMIN-A in cortex, and (f) P-CaMKII levels in the cortex of Tg mice and WT controls. Corresponding quantification of relative signal intensity for (c) NFAT-1, (e) FILAMIN A, and (g) P-CaMKII normalized to GAPDH, and CaMKII in (h). The data are presented as mean values ± SEM. One tailed t-test was conducted. *p < 0.05. WT mice (n = 3) and Tg mice (n = 3); each n is a pooling of three mice

