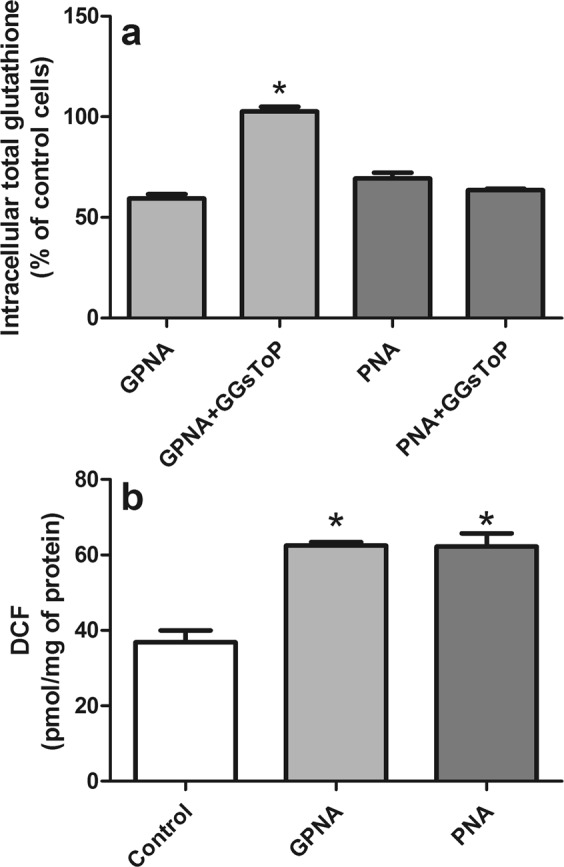
Figure 9.

Effect of GPNA and PNA treatment on intracellular glutathione and ROS levels. A549 cells were treated with GPNA (250 μM) or PNA (50 μM) for 48 hrs. Where indicated, GGsToP (20 μM) was added to the incubation medium. At the end of the incubation total intracellular glutathione (a) and intracellular ROS (b) were measured. Data are expressed as means ± s.d. of three values and were analyzed by one-way ANOVA with Newman–Keuls test for multiple comparisons. For (a), (*)p < 0.01 as compared to “GPNA”. For (b), (*)p < 0.01 as compared to “Control”.
