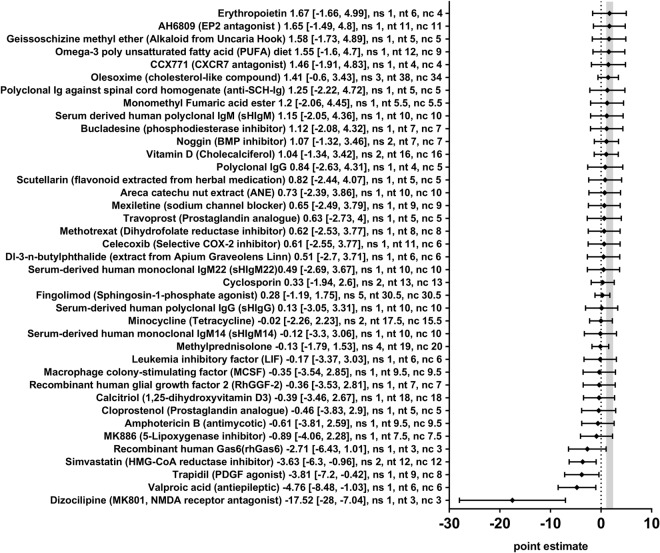
Figure 6.
Forest plot of the included studies for the outcome remyelination (part 2). The diamond indicates the global estimate and its 95% confidence interval (CI). The numbers listed after a certain intervention are: the exact effect size with its 95% CI, the number of included studies for a certain intervention (ns), the total number of treated animals (nt) or control animals (nc). The gray bar indicates the 95% CI of the overall effect size. References are given in the Supplementary Information.

