Figure 4.
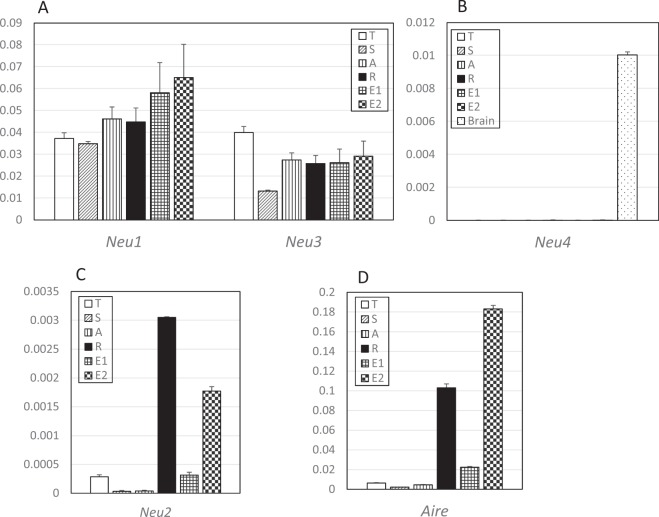
Relative expression levels of Aire and the four sialidases in fractionated cells from C57BL/6. (A) relative expression levels of Neu1 and Neu3 in total thymocytes (T, white bar), T-single cell (S, diagonal lined bar), T-aggregated cell (A, vertical lined bar), residual non-T (R, black bar), first enzyme treated (E1, grid bar), and second and third enzyme treated fractions (E2, checked pattern bar) from C57BL/6 mice (male, 6 W) compared to the expression levels of β-actin. (B–D) relative expression levels of Neu4, Neu2, and Aire in the six cell fractions. Total brain RNA was used as the positive control in the reaction of Neu4 (dotted bar). All values are the averages of duplicates.

