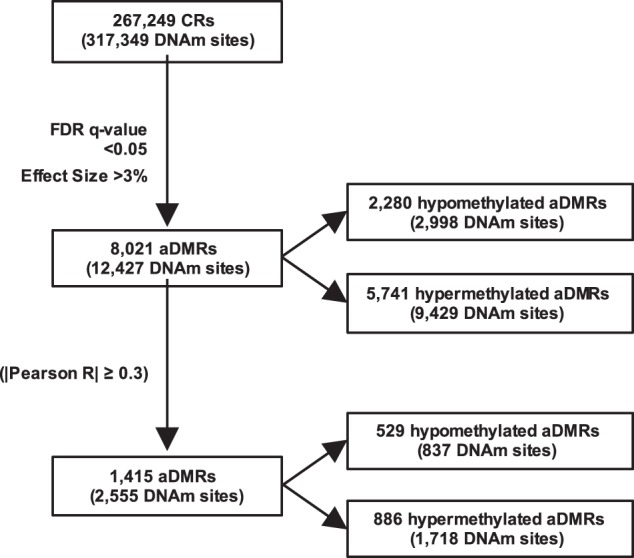
Fig. 1. Detecting age-associated differential DNA methylation.

The 317,349 DNA methylation (DNAm) sites for which data existed after preprocessing and filtering were grouped into 267,249 candidate regions (CRs). Of the 267,249 CRs, 8021 were differentially methylated between age groups, i.e., differentially methylated regions (aDMRs) (FDR < 0.05 and effect size > 3%). Of the 8021 aDMRs, DNAm at 1415 correlated strongly with local gene expression (|Pearson R| ≥ 0.3)
