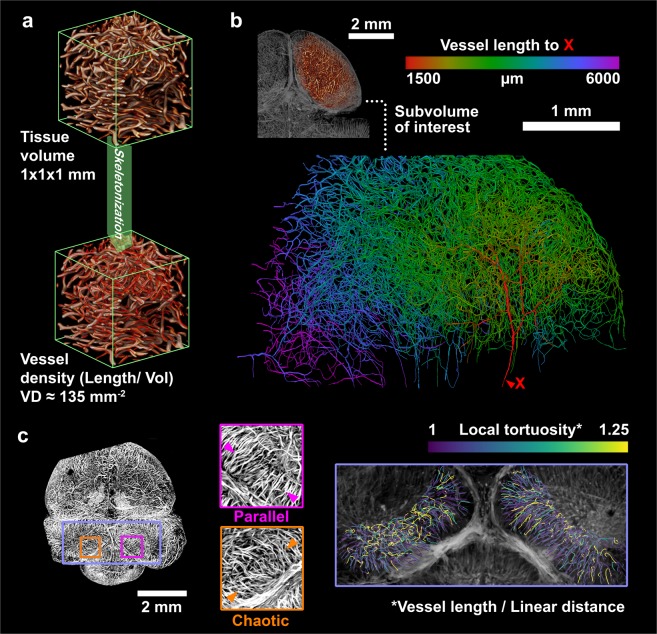
Figure 3.
SLIME data from embryonic quails brains, demonstrating possible quantitative analysis. (a) Example vessel density (vessel length/unit volume) calculations from an arbitrarily selected 1 × 1 × 1 mm volume from the center of a normal E9 quail brain. More information about the vessel density measurement is shown in Supplemental Fig. 7. (b) Distance map showing the connected vessel length from near the beginning of the posterior cerebral artery. (c) Preliminary SLIME data indicates potential abnormalities in an E9 quail brain after ethanol exposure. The image on the left is a maximum intensity projection rendered from a 1 mm thick section in the middle of the SLIME volume, with colored boxes indicating close-up views of local regions. Symmetrical anatomical regions (left/right cerebellar hemispheres) showing distinct vascular patterns (middle) and local tortuosity (right), potentially due to ethanol exposure.

