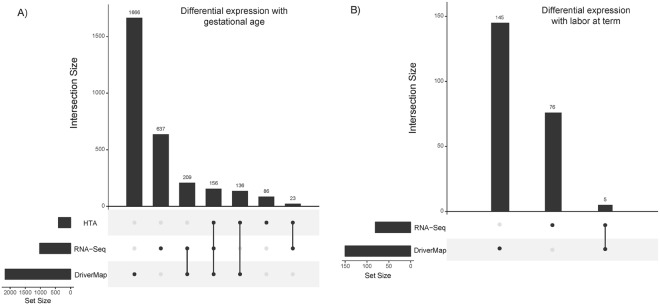
Figure 1.
UpSet plots of genes differentially expressed using three transcriptomic platforms. Changes with gestational age (term vs preterm) (left) and with labor status (term in labor vs term not in labor) (right). The significance of gene expression changes was inferred based on an adjusted p-value (q-value) <0.1. The horizontal bars show the number of differentially expressed genes identified by each method, while the vertical bars display the size of sets of genes identified by only one method and the intersection sets.

