Figure 3.
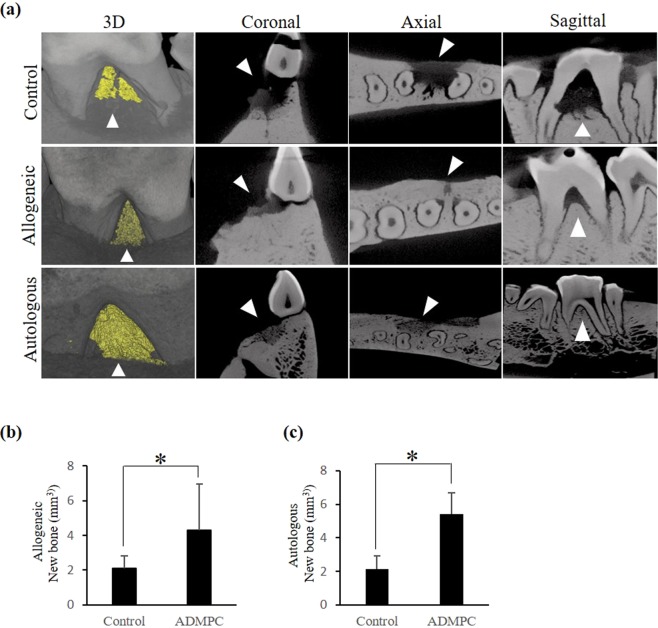
µCT analysis of new bone regeneration by allogeneic ADMPC. (a) Three-dimensional reconstruction of µCT images of the furcation defect is shown. The yellow area highlighted by the arrowhead represents new bone formation within the defect area under 3D view. Furcation defect area viewed in the coronal, axial and sagittal views; the persistence of radiolucency (arrowhead) observed in the defect area in the control sample (upper panel) compared with increased radiopacity (arrowhead) in the defect area of allogeneic (middle panel) and autologous (lower panel) ADMPC transplants. Quantification of regenerated alveolar bone from reconstructed three-dimensional µCT images showing that the amount of newly formed bone was significantly higher in (b) allogeneic and (c) autologous ADMPC transplants compared with the control group. (Data are expressed as the mean ± S.D). *p < 0.05 compared with the control.

