Figure 2.

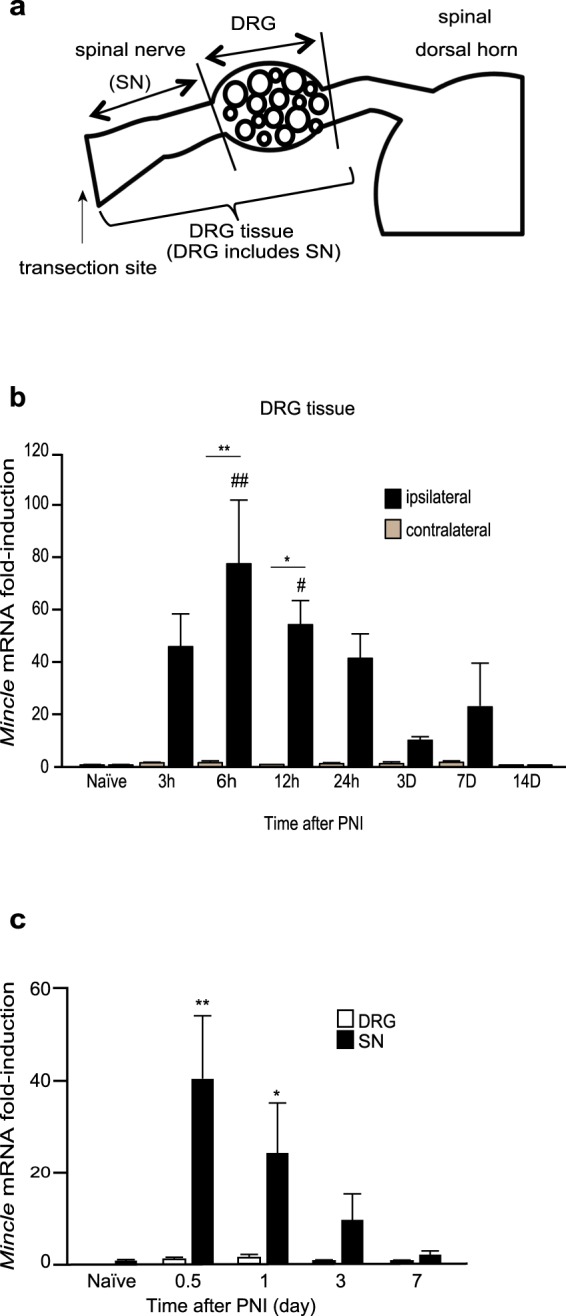
PNI induces expression of Mincle mRNA in injured spinal nerve. (a) Schematic representation of the tissue used for real-time PCR analysis. (b,c) The time course of Mincle mRNA expression before (naïve) and after PNI in WT mice. The expression level of Mincle gene was normalized to that of Gapdh gene. (b) Total RNA was obtained from the DRG tissue, which includes the SN (a). Data are presented as fold-induction compared to naïve contralateral side (n = 4–5 in each group, two-way ANOVA followed by Tukey’s post hoc test, #P < 0.05, ##P < 0.01 vs. naïve, *P < 0.05, **P < 0.01 vs. contralateral side). (c) Total RNA was obtained from the SN or DRG (a). Bar graphs show fold-change relative to the naïve SN (n = 3–7 in each group, one-way ANOVA followed by Dunnett post hoc test, *P < 0.05, **P < 0.01 vs. naïve controls). Values are mean ± SEM.
