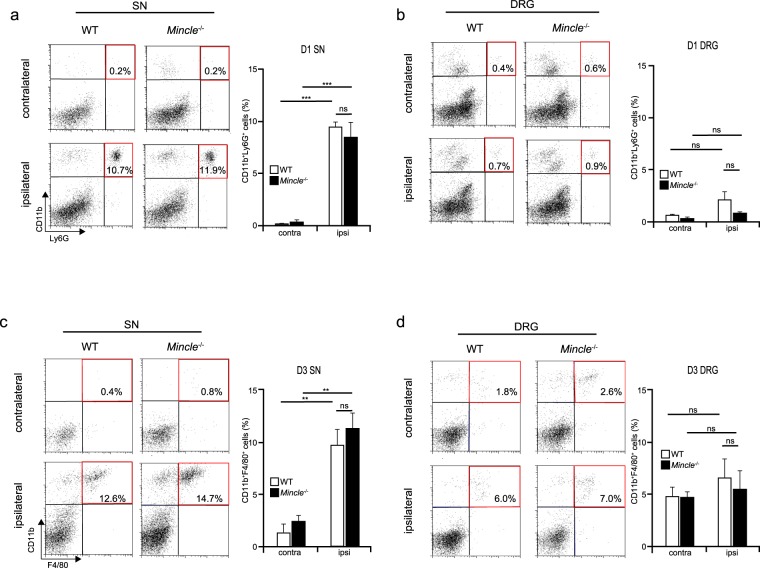
Figure 5.
Normal leucocyte infiltration at the injured site of Mincle−/− mice. Representative flow cytometry dot plot of CD11b+Ly6G+ cells in the SN (a) and DRG (b) 1 day after PNI. Upper-right quadrant (red frame) of the left panels representing infiltrating neutrophils (CD11b+Ly6G+). The bar graph (right) summarises the proportions of neutrophils in the ipsilateral or contralateral tissues of WT or Mincle−/− mice (n = 5 in each group, one-way ANOVA followed by Tukey’s post hoc test, ***P < 0.001 vs. contralateral side). Representative flow cytometry dot plot of CD11b+F4/80+ cells in the SN (c) and DRG (d) 3 days after PNI. Upper-right quadrant (red frame) of the left panels representing infiltrating monocytes/macrophages (CD11b+F4/80+). The bar graph (right) summarises the proportions of monocytes/macrophages in the ipsilateral or contralateral tissues of WT or Mincle−/− mice (n = 4 in each group, one-way ANOVA followed by Tukey’s post hoc test, **P < 0.01 vs. contralateral side). Values are mean ± SEM.

