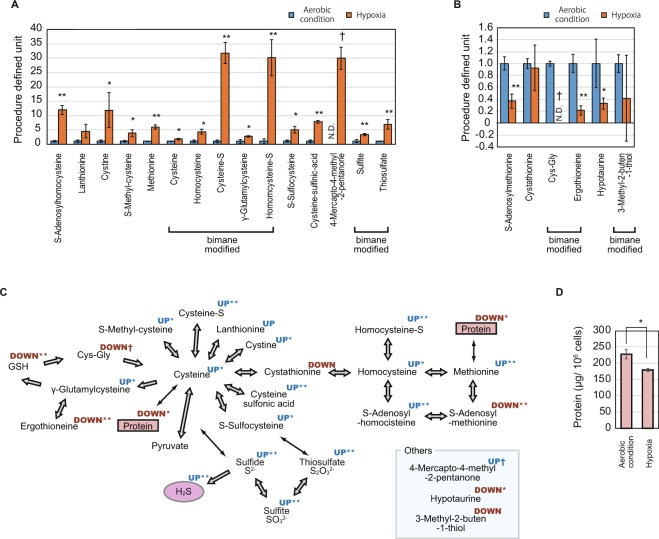
Figure 3.
Increased and decreased sulfur compounds in hypoxia. (A,B) Relative quantification of increased (A) and decreased (B) sulfur-containing compounds in the cells in aerobic conditions and hypoxia. Procedure defined unit is calculated by normalizing the LC/MS signals to that of aerobic condition for each compound. Error bars indicate SD. N.D. indicates that the compound is not detected in the condition. n = 3, *p < 0.05 t-test, **p < 0.05 t-test with Bonferroni’s correction, †compounds are not detected in either of the conditions. (C) An illustration of the metabolic network of sulfur compounds. The arrows between compounds indicate metabolic reactions. The superscript for each compound indicates the upregulation (UP) or downregulation (DOWN) of the compound with or without a mark indicating the significant difference (*p < 0.05 t-test, **p < 0.05 t-test with Bonferroni’s correction, †compounds are not detected in either of condition). (D) Quantification of protein in the cells in aerobic conditions and hypoxia. Error bars indicate SD. n = 3, *p < 0.05 t-test.

