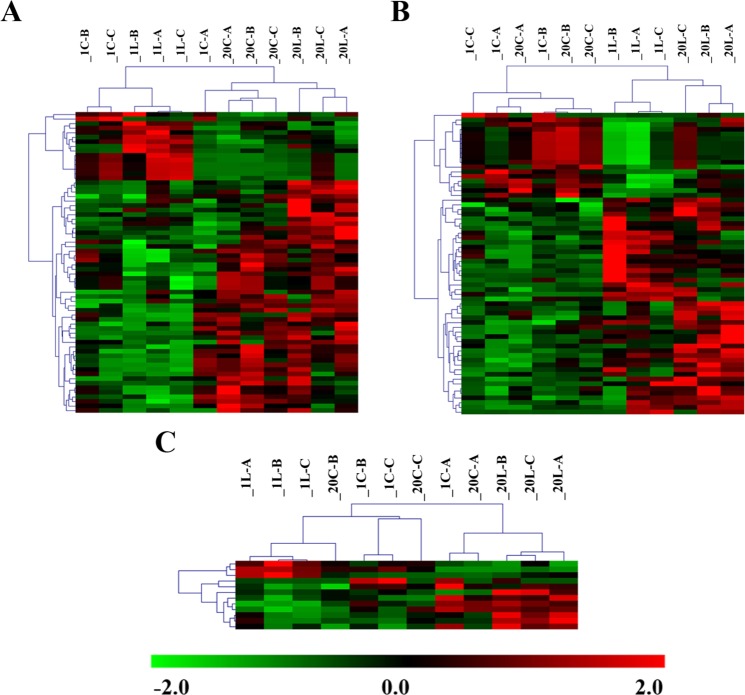
Figure 1.
Hierarchical clusters of significant abundant proteins. The protein abundance is shown as a colour code, from green (lower abundance) to red (higher abundance). (A) Hierarchical cluster based on abundance differences between ecotypes (p < 0.05). (B) Hierarchical cluster based on abundance differences between control and low temperature treatment (p < 0.05). (C) Hierarchical cluster based on abundance differences of proteins with significative interaction between factors (p < 0.05). Three biological replicates are represented for each treatment, in each graph. 1C, MG-1 Control; 1L, MG-1 Low temperature; 20C, MG-20 Control; 20L, MG-20 Low temperature.

