Figure 7.
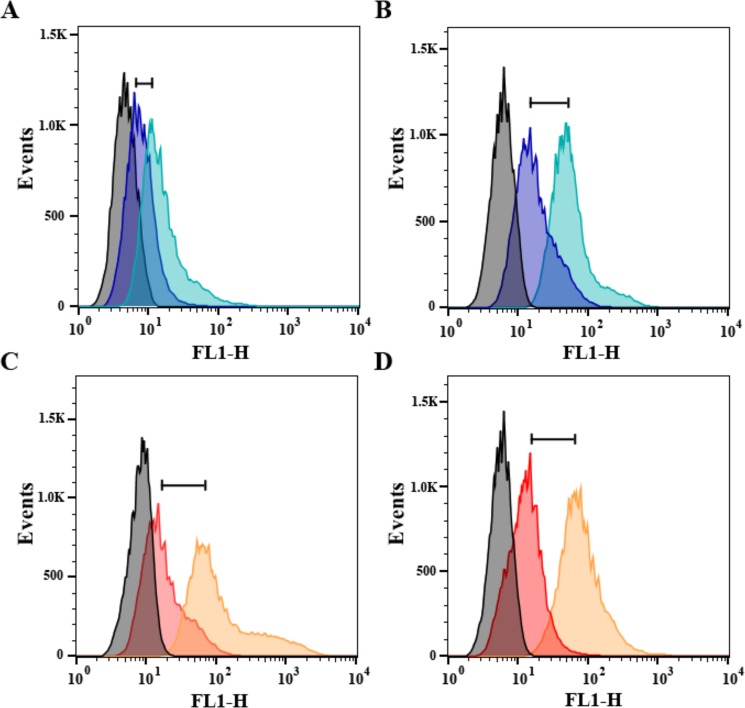
Representative histograms showing FL1 fluorescence intensity of cells population of L. japonicus leaves under low temperature. (A,B) Histograms of MG-1 cells under control and low temperature treatment, respectively. Blue histogram: incubation with DCF-DA without light. Light blue histogram: incubation with DCF-DA and light. (C,D) Histograms of MG-20 cells under control and low temperature treatment, respectively. Red histogram: incubation with DCF-DA without light. Orange histogram: incubation with DCF-DA and light. Grey histograms: incubation without DCF-DA or light. A total of 40.000 events were analyzed in each case.

