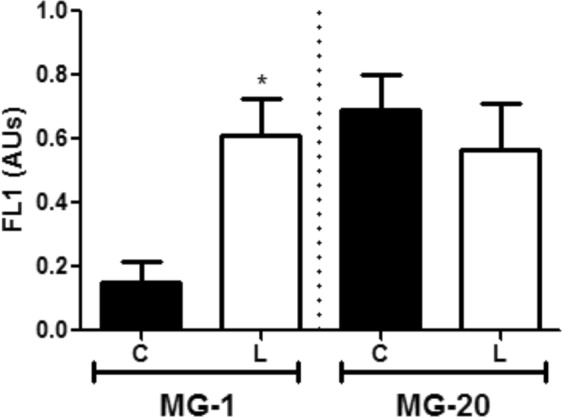
Figure 8.

ROS production quantification by flow cytometry. The DFC-DA fluorescence intensity (FL1) was calculated in each case using the formula in Materials and Methods. Values are the mean ± SD of 5 biological replicates and are expressed as arbitrary units (AUs), for each ecotype and treatment. The asterisk indicates differences between control and low temperature treatments (Student’s test, p < 0.05), for each ecotype respectively. C, Control; L, Low temperature.
