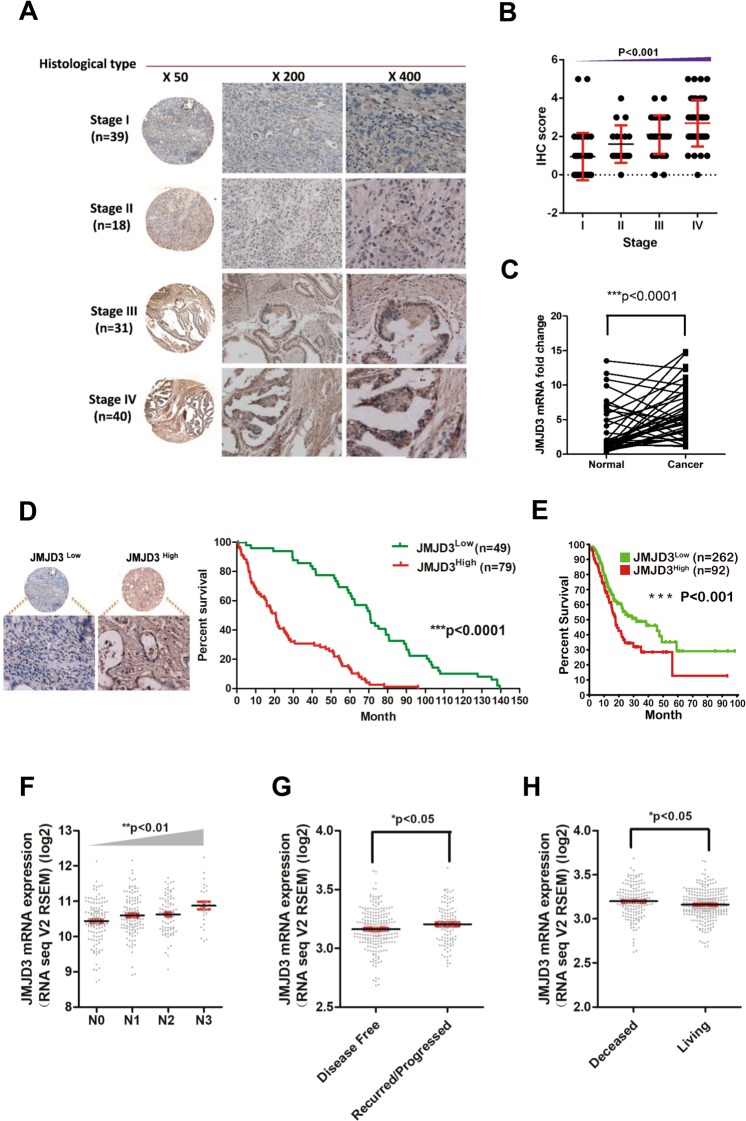
Figure 1.
Expression level of JMJD3 in GC and its association with patient survival and clinical parameters. (A) Expression level of JMJD3 was determined by IHC staining in tissue microarray containing 128 GC patient samples. (B) Statistical analysis of IHC result in different tumor stage. (C) JMJD3 was upregulated in 41 GC patient cohort as determined by realtime PCR. (D) High JMJD3 expression predicts poor patient survival in the 128 GC patient cohort. (E) High JMJD3 expression predicts poor patient survival in TCGA dataset. (F) JMJD3 expression escalated with tumor stage as analyzed by cBioportal using TCGA data. (G) Disease free patient had lower level of JMJD3 compared with recurred/progressed patient as analyzed by cBioportal. (H) Living patient had lower level of JMJD3 compared with deceased patient as analyzed by cBioportal. *p < 0.05, **p < 0.01 and ***p < 0.001.

